Why have global shark and ray landings declined: improved management or overfishing?
Paper by Lindsay N K Davidson, Meg A Krawchuk, Nicholas K Dulvy
By Pat Goebel, SRC Intern
A drop in shark and ray landings may be thought of as a success for in improved management strategies. However, in the case of Davidson et al (2015), that is too good to be true. Unfortunately, the decline in global shark and ray landings has been attributed to overfishing and other ecosystem influencers.
Sharks and rays are commercially valuable for their fins, meat, liver, oil and skin with their fins and meat. The demand for shark products is relatively new concept, as their commercial value has increased with the decline of other valuable fisheries. As on could assume with supply and demand, the high demand of shark products leads to an increase in fishing pressure. The increase in fishing pressure combined with the lack of laws regulating the shark and ray fishery, lead to the depletion of shark and ray populations. The rapid decline in shark and ray populations resulted in new management strategies. Davidson et al (2015), investigated these new management strategies to determine if declines in shark and ray catches were a result of the fisheries management performance or overfishing.
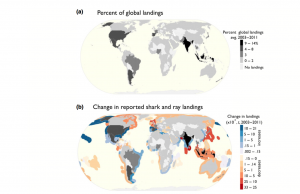
Shark and ray landings peaked in 2003 and have declined by about 20% in the past decade. Davidson et al. (2015), noted that the decrease is more likely related to overfishing than management implementations. The official harvest number used in this study is possibly two to three times below the actual number of sharks and rays being caught. This study highlights the fact that sharks and rays are being harvested at an unsustainable rate. Moreover, Davidson et al (2015), stressed several countries that warrant prioritization for conservation and management action. The greatest declines were reported in Pakistan and Sri Lanka, both of which have little to no management or enforcement. If new management strategies are not implemented into these countries, elasmobranch populations will continue to be harvest at a detrimental scale.

Figure 2. Global distribution of (a) country-specific shark and ray landings averaged between 2003 and 2011 and mapped as a percent of the total. (b) the difference between the averages of landings reported in 2001-2003 and 2009-2011


Leave a Reply
Want to join the discussion?Feel free to contribute!