Posts

Global Warming is Creating an All-Female Sea Turtle Population

By: Konnor Payne, SRC Intern

Unbeknownst to the majority of people, sea turtles have an attribute, like many reptiles, in which the sex of the animal is determined by temperature. This characteristic is called “temperature-dependent sex determination”, which means the sex, of a sea turtle, is determined during the second trimester of incubation. Eggs at 27.7°C or below will become male sea turtles and eggs at 31°C or greater will become female sea turtles. Between these two temperatures (27.7°C and 31°C), the sex, of the sea turtle, is random (Yntema and Mrosovsky, 1982). As a consequence of this basic reproductive component, coupled with global warming increasing the temperature of the nest, a bias has formed in the sex ratios of all sea turtles towards the females (Laloë, 2016). All around the world are reports of 100% female clutches found in critical nesting sites in Barbados, Caribbean, Cyprus and the Mediterranean. The feminization of the sea turtle population has resulted in 85.9-93.5% of all sea turtles developing as females (Laloë, 2016). Projections predict that females will make up over 95% of the hawksbill population by 2045 and 2028 for leatherbacks, but green sea turtles passed this percentage in 2009 (Laloë, 2016).

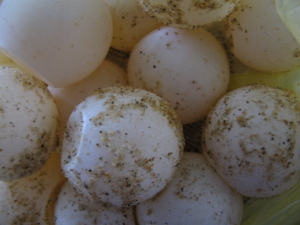
Figure 1. Sea turtle eggs in an underground nest on a beach.

Although the sex is heavily skewed towards females the mating behaviors of sea turtles has prevented population issues from arising currently. Female sea turtles are not monogamous and will mate with multiple partners during a breeding season allowing fewer males necessary to fertilize all clutches (Pearce & Avise, 2001). Females can store sperm in their bodies for extended periods of time to fertilize multiple clutches at the appropriate time, reducing the frequency in which females need to contact males (Lee, 2008). The two sexes have separate breeding seasons in which the males breed more often than the females (Hays et al., 2014). These combined mating behaviors help to alleviate the problems of a biased sex population, but with the newest IPCC report indicating only increasing future global temperatures, the males will become too rare to replenish the population.

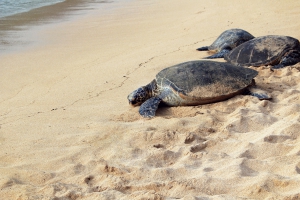
Figure 2. Female green sea turtles on a beach in Maui preparing to make a nest to lay their eggs.

Not only is there a sex bias, but global sand temperatures have begun to rise above the optimal temperature range and into the lethal zone above 32.4°C, depleting the already low populations (Moran et al., 1999). All seven species of sea turtles are classified as critically endangered, endangered or vulnerable by the International Union for the Conservation of Nature. The sand surrounding the clutch of eggs is warmed by the Sun and the atmosphere, as well as the metabolic activity of the eggs (Ackerman et al., 1985). At higher temperatures the metabolic activity of the hatchlings increases, such that the oxygen levels in the nest can decline to suffocate the hatchlings (Ackerman et al., 1985). If a hatchling does not suffocate the heat may cause thermal inhibition of muscle movement preventing them from leaving the nest (Moran et al., 1999). In the past hatchling rates were consistently above 90%, but projections show that by 2100 hatching success will gradually drop to 50.95-78.92% (Laloë, 2017). The heat from the global warming will cause causalities of sea turtles that are already struggling, which will emphasize the female dominance even more.

The future appears grim for sea turtles but there are strategies to help balance the sex ratio and lower heat stress on the hatchlings. The common problem of hatchling death and skewed sex ratio is the nest has too high of a temperature so the methods to solve both problems are to reduce the temperature of the surrounding sand. Sprinkling water at night or over a shaded area of sand consistently lowered the temperature of the sand near the nest by about 2.25°C (Jourdan, 2015). However, the source of water has to be underground via pipes or another method as an above ground source is heated in the day and causes even higher fluctuations in sand temperature than without sprinkling. The area has to be shaded by a tarp or natural cover as moist sand uncovered will increase in temperature in the day more than without water added.  The temperature of the sand decreases the deeper the nest is made, as a nest one meter lower than another is about 1°C cooler (Jourdan, 2015). Once nests are identified they can be dug up and moved deeper into the sand as the hatchlings will still be able to climb out of the nest since larger female sea turtles typically dig deeper nests than the average and have similar emergence rates (Jourdan, 2015). Most sea turtles nest during the warmest months of the year and evidence suggests that they can adapt to the warming temperatures to alter their nesting times to cooler months (Hays, 2014). Although humans have accelerated global warming, that now threatens the existence of all sea turtles, there are methods in which they can be saved.

Work Cited:

Ackerman RA, Seagrave RC, Dmi’el R, Ar A (1985) Water and heat exchange between parchment-shelled reptile eggs and their surroundings. Copeia 1985:703–711

Hays, G. C., Mazaris, A. D., & Schofield, G. (2014). Different male vs. female breeding periodicities help mitigate offspring sex ratios skews in sea turtles. Frontiers in Marine. Science, 1, 43.

Jourdan, J., and M. M. P. B. Fuentes. “Effectiveness of strategies at reducing sand temperature to mitigate potential impacts from changes in environmental temperature on sea turtle reproductive output.” Mitigation and adaptation strategies for global change 20.1 (2015): 121-133.

Juskova, Isabella. “Unsplash.com.” Unsplash.com.

Laloë, Jacques-Olivier, et al. “Climate change and temperature-linked hatchling mortality at a globally important sea turtle nesting site.” Global change biology 23.11 (2017): 4922-4931.

Laloë, Jacques-Olivier, et al. “Sand temperatures for nesting sea turtles in the Caribbean: Implications for hatchling sex ratios in the face of climate change.” Journal of Experimental Marine Biology and Ecology 474 (2016): 92-99.

Lee, P. L. M. (2008). Molecular ecology of marine turtles: new approaches and future directions. Journal of Experimental Marine Biol- ogy and Ecology, 356, 25–42.

Moran KL, Bjorndal KA, Bolten AB (1999) Effects of the thermal environment on the temporal pattern of emergence of hatchling loggerhead turtles Caretta caretta. Mar Ecol Prog Ser 189:251– 261

Pearce, D. E. & Avise, J. C. (2001). Turtle mating systems: behavior, sperm storage, and genetic paternity. Jounral of Heredity, 92, 206-211.

Yntema CL, Mrosovsky N (1982) Critical periods and pivotal temperatures for sexual differentiation in loggerhead sea turtles.

Yong, Mohamed. “Sea Turtle Egg.” Wikipedia.org, 7 Sept. 2007.


Reconciling Development and Conservation under Coastal Squeeze from Rising Sea Level

By Timothy Hogan, SRC Intern

In the face of global warming, melting ice caps and thermal expansion gradually increase sea level, affecting the majority of the world’s coast. As a result, coastal ecosystems, such as mangrove forests and salt marshes, will lose a large amount of their diversity. The loss of settlements to flooding may also trigger massive migrations to inland cities (Nichols et al 2011), which can have many detrimental effects in and of itself. Preventative measures taken by coastal management should therefore prioritize both urban development and the shoreline’s ecosystem. Multiple views should be taken into consideration when determining adaptation strategies, since it involves a complex balance of socioeconomic pressures. However, for the sake of simplicity, most models focus on a specific set of aspect rather than the whole picture. As a consequence, these models tend to produce both conflicting and inconclusive results. This uncertainty, coupled with the innate short-sightedness of the human race, makes it becomes difficult for policymakers to create effective and scientifically supported regulations (Nicholls et al 2010).

Despite this lack of direction, environmentalists have developed many effective ways to counter sea level rise Two of these popular coastal management practices include coastal armoring and managed realignment. Coastal armoring involves the development of levees, which are effective walls of sediment, to stop water levels from spreading along the coast. While it is simple to implement and can be more cost-effective, it tends to cause “coastal squeeze”, which prevents the natural migration of marshes and mangroves (Pontee 2013). Should water level rise above the levee, the water tends to overflow and form more destructive floods, causing as much damage as what would have naturally occurred (ASFPM 2007). Managed realignment involves the manual movement of the shoreline, and is much less detrimental to nearby ecosystems (French 2006). However, this work tends to be a more expensive investment, and the withstandability and long-term impacts of the new shoreline remain unknown. Choosing between these methods effectively comes down to expenses, cost, long-term effects, and the nearby ecosystem. However, modern technology shows that the best solution may not be as simple as choosing one of these practices.

A recent study analyzed the effects of sea level rise on a coastal region in Queensland, Australia, due to its close proximity to a fast-growing city and coastal embayments. Data sets were compiled and analyzed to spatially quantify urban growth, land usage, ecosystem motion, coastal protection, and flooding. All information was combined using Marxan, a geographic information system that could spatially display and compare the gathered data. The developed map was divided into zones of equal area. Based on predicted sea level rise, urban growth, and environmental changes, the price of utilizing either coastal armoring, managed realignment, or both was calculated for each zone. An overall “trade-off” curve was produced by testing each possible scenario, and can be used to find the most optimal solution financially and conservationally.

Figure 1: A flowchart displaying the overall process behind the experimentation. Five sets of data (urban growth, land usage (acquisition), ecosystem migrations, coastal protections, and flooding (coastal inundation) were transformed into models, and combined using geographic information softwares. Testing scenarios allowed them to discern the most financially and environmentally viable solutions (Mills et al 2015).

Figure 1: A flowchart displaying the overall process behind the experimentation. Five sets of data (urban growth, land usage (acquisition), ecosystem migrations, coastal protections, and flooding (coastal inundation) were transformed into models, and combined using geographic information softwares. Testing scenarios allowed them to discern the most financially and environmentally viable solutions (Mills et al 2015).

According to the data analysis, 70% of both urban and conservation goals provides optimal benefits for both parties, while also saving billions of dollars. Any less provides fewer benefits and risks, whereas more tends to be detrimental and expensive. While this may seem counterintuitive, it makes sense given the effects of retreats. When established, the changed land and new funding will decreases the number of necessary ecosystem services, including fishing, carbon storage, and water purification. Hopefully, these insights may show institutions and committees the hidden savings behind ecological preservation, as well as protecting cities.

Figure 2: Visual representation of the land distribution and trade-off curve. Blue zones represent managed rearrangement, or “retreat”, and red zones represent coastal armoring, or “defence”. The blue curve on the graph shows likely scenarios based on global sea level rise estimations. The distribution of those was set along a trade-off curve, which showed the approximate price for utilizing each method. The price range for each displayed scenario is also shown for reference (Mills et al 2015).

Figure 2: Visual representation of the land distribution and trade-off curve. Blue zones represent managed rearrangement, or “retreat”, and red zones represent coastal armoring, or “defence”. The blue curve on the graph shows likely scenarios based on global sea level rise estimations. The distribution of those was set along a trade-off curve, which showed the approximate price for utilizing each method. The price range for each displayed scenario is also shown for reference (Mills et al 2015).

While this study provided a new effective way to analyze benefits of coastal management practices, it still required the same simplicity. Vegetation, erosion, and the change of infrastructure over time were not sufficiently considered into the study, which causes predicted values to be lower than in reality. Corrections can be made with the assistance of experts in these fields. However, this new model manages to provides a new important element to non-scientists: direction. The trade-off curve is able to quantify various benefits of conservation and urbanization to find financially favorable solutions. This can act as guidance to policymakers, and may encourage them to focus on the long-term benefits of coastal lands and developments. While this may not necessarily solve the looming issues of sea level rise or address all of its repercussions, it gives vulnerable coastal civilization and environments a way to withstand the relentless rising sea.


References

Nicholls, R. J., and Cazenave, A. (2010). Sea-Level Rise and its Impact on Coastal Zones. Science, 328, 1517-1520.

Pontee, N. (2013). Defining Coastal Squeeze: A Discussion. Ocean & Coastal Management, 84, 204-207

Nicholls, R. J., Marinova, N., Lowe, J. A., Brown, S., Vellinga, P., de Gusmão, D., Hinkel, J., and Tol, R. S. J. (2011). Sea-level rise and its possible impacts given a ‘beyond 4°C world’ in the twenty-first century. Phil. Trans. R. Soc. A, 369, 161-181.

Mills, M., Leon, J.X., Saunders, M.I., Bell, J., Liu, Y., O’Mara, J., Lovelock, C.E., Mumby, P.J., Phinn, S., Possingham, H.P. and Tulloch, V.J. (2015). Reconciling Development and Conservation under Coastal Squeeze from Rising Sea Level. Conservation Letters.

ASPFM. (2007). Levees: the double-edged sword [online]. Association of State Floodplain Managers.

French, P.W. (2006). Managed realignment – The developing story of a comparatively new approach to soft engineering. Estuarine, Coastal, and Shelf Science, 67(3), 409-423.

Climate Change to Cause Polar Bear Population Declines

By Laura Vander Meiden, SRC Intern

Over the next 35-40 years polar bear populations have the potential to decrease by more than 30% according to an assessment by the International Union for Conservation of Nature (IUCN). The report cites climate change and the resulting loss of sea ice as the cause of this probable decline.

Photo by Ansgar Walk vie Wikimedia Commons.

Photo by Ansgar Walk vie Wikimedia Commons.


Polar bears are specifically built to survive the harsh conditions of the arctic. Their adaptations include two types of insulating fur, a deep layer of fat to keep warm while in the water, bumps called papillae on the bottom of their feet for grip on ice, and feeding behaviors designed for living on the ice. Ironically it is these adaptations that make polar bears most vulnerable as the climate changes.

Scientist’s primary concern is the effect melting sea ice has on the eating habits of the bears. Though polar bears have been seen to opportunistically feed on a variety of organisms, their primary source of food is ring seals which live on the edge of the ice. The seals have a very high calorie content, particularly in their blubber, which is necessary for the polar bear’s frigid lifestyle. This allows the bears to build up large fat reserves which are critical as the bears can only hunt seals when there is ice. When seasonal ice melts in the summer, the bears typically must fast, living off their fat reserves, until the ice returns in the winter.

As climate change continues the ice will melt more quickly each summer and take a much longer time to return each winter. This extends the length of time polar bears must fast, resulting in higher chances of starvation. Melting ice and the subsequent reduced access to food can also lead to an overall decrease in body condition, reduced survival rates of cubs, loss of denning habitat and increased drowning as the bears attempt to swim between ice floes.

Polar bears are found on four different sea ice regions. The populations found in the region where ice is the most seasonal are at present in the most danger from climate change. Also vulnerable are populations in the divergent ice region where ice forms along the shore, but is not always connected to pack ice further out to sea. Safest are populations in the region where convergent ice connects the bears to pack ice and the archipelago region where ice remains year round. The latter region is expected to be the final refuge of the bears, but unless carbon dioxide emissions are reduced even this ice will be melted in 100 years.

Of 19 subpopulations 3 are declining, 6 are stable, 1 is increasing, and 9 have insufficient data to make a determination. Map via Norwegian Polar Institute.

Of 19 subpopulations 3 are declining, 6 are stable, 1 is increasing, and 9 have insufficient data to make a determination. Map via Norwegian Polar Institute.

While the situation for the polar bears appears dire, scientists have not completely lost hope. If significant reductions are made in greenhouse gas emissions, the amount of time before the sea ice melts could be extended. However scientists warn that action must be taken soon, since once a tipping point is reached sea ice will decrease rapidly and no amount of emission reduction will be able to stop the ice from melting.

Effect of Climate Change on Pacific Tuna Stocks

By Beau Marsh, RJD Intern

Pacific tuna fisheries are essential to the livelihood, sustainability and well-being of many Pacific islands, they acts as an important food source, as well as a lucrative activity for local economies.  The species of tuna composing these fisheries are Skipjack (Katsuwonus pelamis), Yellowfin (Thunnus albacares), Bigeye (Thunnus obesus), and Albacore (Thunnus alalunga).  Skipjack are particularly significant because they regularly make up more than 60% of the Pacific tuna catch (Ganachaud et al., 2013).  It is important to learn as much as possible about the conditions in which the different tuna species spend their time, so habitat shifts in response to climate change and El Nino Southern Oscillation (ENSO) can be anticipated.

Tuna are considered thermoregulators (Lehodey et al., 2010).  This means that they can tolerate a greater range of temperatures by maintaining a fairly constant internal temperature.  The mechanism by which this is possible is called countercurrent heat exchange, through which their circulatory system conserves heat more effectively (Lehodey et al, 2010).  This mechanism is more developed in certain tuna species, so different species occupy different parts of the water column based on temperature.  Adult Skipjack reside in waters ranging from 20-29 degrees Celsius (Ganachaud et al., 2013).  Other species, including Bigeye and Albacore, are capable of living at cooler temperatures, allowing them to dive to deeper depths.  Bigeyes can dive to around 600 meters in about 5 degree Celsius water (Brill et al., 2005), whereas Skipjack are restricted to the upper 200 meters (Lehodey et al., 2010).

These environmental conditions do not apply to tuna larvae.  In the larval stage, tuna are more sensitive to environmental factors.  They require stricter physical and chemical conditions.  The different species’ larvae spend all their time at the surface where the warmest water and food supplies are consistent (Brill et al, 2005).  Distributions of tuna depend on horizontal stratifications by temperature, as well as the depth of the mixed layer (Ganachaud et al., 2013).  Ideal conditions are formed by the convergence and divergence of ocean currents that create thermal fronts, locations of upwelling, and eddies (Langley et al, 2009).  These physical boundaries, combined with foraging areas, dictate tuna distributions basin-wide.

The physical boundaries are the Pacific Equatorial Divergence (PEQD), the West Pacific Warm Pool (WPWP), the North Pacific Subtropical Gyre (NPSG), and the South Pacific Subtropical Gyre (SPSG) (Ganachaud et al., 2013).  In the case of the Skipjack, over 90% of the population resides in the WPWP, specifically, along the eastern front at its boundary with the PEQD (Fig.1) (Ganachaud et al., 2013).

Fig. 1

SST and superimposed Pacific hydrological factors (Ganachaud et al, 2013).

In contrast to the WPWP, the waters of the central and eastern Pacific are characterized by higher salinity (>35 psu) and increased concentration of nutrients (Maes et al, 2006). This is explained by the strong wind-driven upwelling that takes place along the west coast of South America and the Ekman-driven divergence that occurs in the Central Equatorial Pacific (Picaut et al, 2001).  Due to the strong difference between the WPWP and the PEQD, the boundary of these water masses exhibits unique physical, chemical and biological characteristics and is the location of most tuna fisheries in the Pacific (Lehodey et al, 2010). Although the abundance of tuna in warm, oligotrophic waters in the WPWP is counter-intuitive at first glance, convergence zones such as the one between the WPWP and the PEQD are known to act as aggregating mechanisms of plankton and micronekton and, subsequently, large predators.The western equatorial Pacific presents one of the most prolific areas for tuna in terms of spawning and foraging grounds (Ganachaud et al, 2013).  Formed by the wind-driven South Equatorial Current (SEC), the WPWP is characterized by the highest sea surface temperature of the world’s oceans (often reaching more than 30°C) and low sea surface salinity caused by increased precipitation (McPhaden and Picaut, 1990; Picaut et al, 2001; Maes et al, 2006). As a result of this accumulation of water in the western Pacific, the thermocline in the WPWP is considerably deeper than along the central and eastern Pacific; this inhibits deep vertical mixing and makes the WPWP an area of low nutrients and low primary productivity (Picaut et al, 2001).

Fig. 2

Schematic drawing illustrating a possible aggregation mechanism for plankton and micronekton (Yoder et al, 1994)

The WPWP-PEQD convergence boundary is not static; it’s modulated by the extent and location of the WPWP and has a well defined interannual variability that is strongly linked to the phase of ENSO. McPhaden and Picaut (1990) first observed the migration of the WPWP in relation to ENSO; they reported a strong eastward displacement of the eastern boundary of the WPWP during El Niño and associated this shift to a reversal of the SEC caused by weakened trade winds.  Later, Lehodey et al (2010) reported a strong correlation between the location of the WPWP-PEQD boundary (using the 29° C isotherm as a proxy), the abundance of Skipjack tuna and the phase of ENSO; they reported clear eastward population shifts during the warm phase of ENSO.  Other approaches have been used to ascertain the location of the convergence zone and its variability; Maes et al (2006) identified a strong salinity gradient (0.4 psu over 10°-15° in longitude) to be a more accurate indicator, and more recently have used satellite-based ocean color observations to detect the eastern edge of the WPWP (Maes et al, 2006).

In an attempt to incorporate climate change predictions into tuna population models, Lehodey et al (2010) forecast the distribution of Bigeye tuna in the Pacific.  Results of this study showed an expansion of favorable spawning area towards mid-latitudes and to the eastern Pacific; in contrast, the WPWP became too warm and oxygen depleted to sustain stable populations of tuna by the end of the century.

Ganachaud et al (2013) documented changes in oceanographic parameters of importance to tuna distribution in the Pacific.  They reported a large-scale shoaling of the thermocline, increasing stratification and limiting nutrient provision to the biologically active layer. They also highlight changes in oceanic currents such as the strengthening of the NEC which they hypothesize could modify the supply of iron in the eastern Pacific. Ganachaud et al (2013) anticipate an eastward migration of the WPWP-PEQD boundary by 6,000 (±2,000) km.

Global warming will affect the ocean’s physical, chemical and biological characteristics and those changes will have an impact on fisheries and its fish-dependent communities (Hollowed at al, 2013). The extent to which fisheries will be able to continuously provide food for millions of people is contingent upon our understanding of future distributions and abundance of commercially important species such as tuna.

Attempts should be made to provide new insight into future spawning and foraging favorable grounds for tuna in the Pacific Ocean. Traditionally, the areas near the NPSG and the SPSG have been overlooked and categorized as low productivity areas. Nevertheless, the NPSG-PEQD and SPSG-PEQD boundaries might exhibit similar oceanographic characteristics to those found in the convergence zone at the WPWP-PEQD boundary and it is possible that under a global warming scenario these areas will become more favorable for tuna populations.  Efforts should be made to ascertain the suitability of these regions as potential future tuna habitats.


References

Brill, R. W., Bigelow, K. A., Musyl, M. K., Fritsches, K. A., & Warrant, E. J. (2005). Bigeye Tuna (Thunnus obesus) Behavior And Physiology And Their Relevance To Stock Assessments And Fishery Biology, 57(2), 142–161.

Ganachaud, A., Sen Gupta, A., Brown, J., Evans, K., Maes, C., Muir, L. C., & Graham, F. S. (2013). Projected changes in the tropical Pacific Ocean of importance to tune fisheries. Climatic Change, 119, 163-179.

Hollowed, A., Barange, M., Beamish, R., Brander, K., Cochrane, K., Drinkwater, K., Foreman,G.,Hare,J., Holt,J., Ito,S., Kim,S., King,J.R.,Loeng,H., MacKenzie,B.R., Mueter,F.J., Okey,T.A., Peck, M., Radchencko,V.I., Rice,J.C., Schirripa,M.J., Yatsu,Y., Yamanaka,Y.. (2013). Projected impacts of climate change on marine fish and fisheries. ICES Journal of Marine Science, 70(5), 1023-1037.

Langley, A., Briand, K., Sean, K. D., & Murtugudde, R. (2009). Influence of oceanographic variability on recruitment of yellowfin tuna (thunnus albacares) in the western and central Pacific Ocean. Canadian Journal of Fisheries and Aquatic Sciences, 66, 1462-1477.

Lehodey, P., Senina, I., Sibert, J., Bopp, L., Calmettes, B., Hampton, J., & Murtugudde, R. (2010). Preliminary forecasts of bigeye tuna population trends under the A2 IPCC scenario. Progress in oceanography, 86, 302-315.

Maes, C., Ando, K., Delcroix, T., Kessler, W., McPhaden, M., & Roemmich, D. (2006). Observed correlation of surface salinity, temperature and barrier layer at the eastern edge of the western Pacific warm pool. Geophysical Research Letters, 33. doi:  10.1020/2005GL024772

McPhaden, M., & Picaut, J. (1990). El Nino-Southern Oscillation Displacements of the Western Equatorial Pacific Warm Pool. Science, 250, 1385-1388.

Picaut, J., Ioualalen, M., Delcroix, T., Masia, F., Murtugudde, R., & Vialar, J. (2001). The oceanic zone of convergence on the eastern edge of the Pacific warm pool: A synthesis of results and implications for El Nino-Southern Oscillations and biogeochemical phenomena. Journal of Geophysical Research., 106, 2363-2386.

Yoder, J., Ackleson, S., Barber, R., Flament, P., & Balch, W. (1994). A line in the sea. Nature, 371, 689-692.


Cetacean Species Affected by Warming Arctic

By Hannah Armstrong, RJD Intern

Global climate change, among other anthropogenic issues, is becoming an increasingly significant threat to the Arctic region of the world.  Specifically, higher average temperatures and rapidly disappearing sea ice are of conservation concern for ice-dependent species.  Arctic marine mammals are specifically adapted to take advantage of the climatic conditions that have prevailed in the Arctic for millions of years, and have been a target of conservation based on their role in the functioning of Arctic ecosystems and surrounding communities.  Despite these conservation concerns, with impacts of climate change likely to worsen in coming decades, there is increased industrial interest in Arctic areas previously covered by ice.

Armstrong 1

A graph showing the evident decline in average monthly arctic sea ice extent from September 1979 through 2012 (Reeves et al).

In a recent study, scientists observed and mapped the distribution and movement patterns of three ice-associated cetacean (marine mammal) species that reside year-round in the Arctic: the Narwhal (Monodon monceros), Beluga (white whale, Delphinapterus leucas), and Bowhead Whale (Balaena mysticetus) (Reeves et al. 2013).  Then they used these ranges and compared them to current and future activity sites related to oil and gas deposits, exploration, development and commercial shipping routes, to assess areas of overlap, as a means of highlighting areas in the Arctic that might be of conservation concern.  Some of the results indicated the sensitivity of Bowhead whales to industrial activity; the sensitivity of Narwhals to climate change and noise, as well as a shift in distribution due to ice conditions; and the sensitivity of Beluga whales to noise, as well as a wider distribution extending into the sub arctic (Reeves et al. 2013).  These observations ultimately triggered the need for a better understanding of the implications of environmental changes in the Arctic for cetacean species, in order to develop effective conservation and management policies (Reeves et al. 2013).

Poorly documented shipping routes and operations, in addition to accelerating Artic pressures in Arctic Norway, Arctic Russia, the Alaskan Arctic, Arctic Canada and Arctic Greenland, indicate that immediate measures need to be taken to mitigate the impacts of human activities on these Arctic whales, as well as the people who depend on them (Reeves et al. 2013).  As indicated by researchers, some of these measures include: careful planning of ship traffic lanes (re-routing if necessary) and ship speed restrictions; temporal or spatial closures of specified areas (e.g. where critical processes for whales such as calving, calf rearing, resting, or intense feeding take place) to specific types of industrial activity; strict regulation of seismic surveys and other sources of loud underwater noise; and close and sustained monitoring of whale populations in order to track their responses to environmental disturbance (Reeves et al. 2013).

After comparing maps of Arctic whale ranges with maps of recent and anticipated oil and gas activity and shipping traffic in the Arctic, researchers noticed the unquestionable overlap between Arctic whales and harmful human activities.  Based on unparalleled current and predicted rates of climate change, the futures of these three Arctic whale species are uncertain.  Based on the significance of these species, both culturally and for proper functioning of the Arctic ecosystem, well-informed management decisions related to human activities will be imperative going forward.


Reference:

Reeves et al.  Distribution of endemic cetaceans in relation to hydrocarbon development and commercial shipping in a warming Arctic.  Marine Policy 44 (2014).

“Narwhals Breach.” WikiMedia Commons. WikiMedia, 1 Oct. 2012. Web. 29 Jan. 2014.