Posts

Evaluating Extinction Risk in Major Marine Taxa

By Olivia Schuitema, SRC intern

Over Earth’s history, there have been at least five mass extinctions in addition to other minor-scale extinctions (Bambach et al. 2004). The causes of such extinctions are varied, but many be associated with global climate variability (Doney et al. 2012). One article points to large-scale volcanism associated with global warming, acid rain and ocean acidification for the causes of extinctions (Bond et al. 2017). This is especially significant in recent years, because of the large and rapid increase in global temperatures (largely due to the burning of fossils fuels and deforestation) and corresponding varied changes in climate. Thus, in order to understand and predict future extinctions patterns, we must understand past ones.

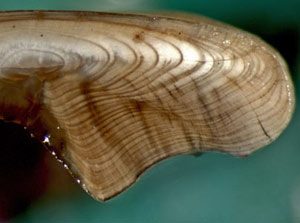
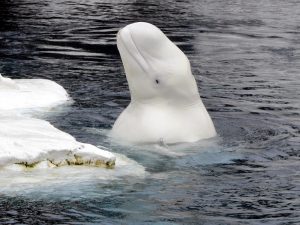
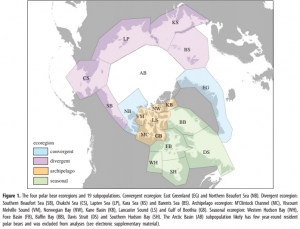
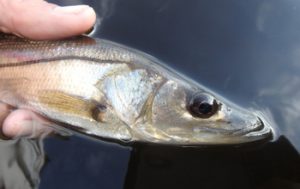
The paleontological record (fossil record), gives much insight on these extinction events, allowing the present to look at past trends. In the effort to understand anthropogenic influence on modern marine biota, the fossil record can be analyzed and compared to the extant (living) groups (Carrasco et al. 2013). Thick fossil-rich marine sediments located around the world contain a plethora of information that can help prepare future extinction trends (Finnegan et al. 2015). These sediments (Figure 1) can give insight on particularly vulnerable taxa in potential danger of going extinct. Vulnerability among a population includes being threatened with a decline in numbers or genetic material, reduced fitness, or extinction (Dawso et al. 2011).

Fossils of various marine and terrestrial organisms are located in layers in the fossil record. The layers can give information on environmental conditions of the time and age of organisms (Wikimedia Commons).

A new study aimed to construct models of extinction risk and utilize them to evaluate baseline extinction vulnerabilities for some living marine taxa (Finnegan 2015). The article defines “extinction risk” as the probability of classifying fossil taxa as “extinct” based on its similarity to other extinct fossil taxa during the same time (Finnegan et al. 2015). The timeline used in the analysis was from the Neogene period to the Pleistocene period, encompassing about 23 million years in total. This time period was chosen to maximize faunal and geographic comparability (Finnegan et al. 2015). Some groups of organisms (taxa) found in this time interval are still living today and have similar geographical distributions as they did in the past. These similarities make it easier to compare marine taxa over varying conditions to help determine intrinsic risk. “Intrinsic risk” as used in the article, is the term for baseline vulnerability for marine taxa.

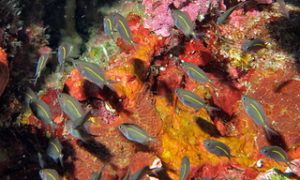
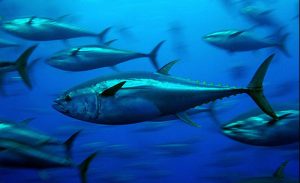
Six major marine taxonomic groups, including bivalves, gastropods, echinoids, sharks, mammals, and scleractinian corals were analyzed in this study (Finnegan et al. 2015). These groups were chosen for their relatively accurate representation of overall marine ecological, taxonomic, and functional diversity. The two best predictors for extinction risk are geographic range size and taxonomic identity (Finnegan et al. 2015). The predictors of extinction found in previous paleontological models (including geographic range size, latitude, etc.), were measured for the six marine taxa. Results indicate that the geographic area with the highest intrinsic risk was the tropics, especially the Indo-Pacific and the Western Atlantic (Finnegan et al. 2015). Similarly, another study highlights the increased extinction rates of North American mammals. Results showed a diversity crash in parts of North America during the Holocene Epoch (Carrasco et al. 2013). Although this mammalian extinction occurred later than the time period analyzed in the work of Finnegan et. al (2015), the geographic locations are similar, supporting the overall increasing extinction trend over time.

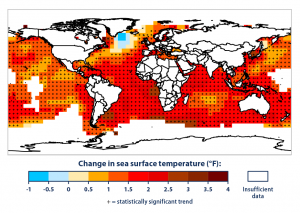
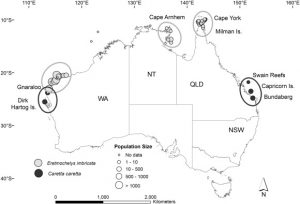
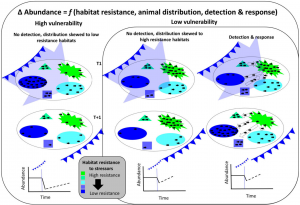
Another modeling system analyzed the hotspots for human activity and climate change velocity in contrast to the areas of high extinction risk of the six major marine genera (Finnegan et al. 2015). The results as seen in Figure 2, show that hotspots of anthropogenic influence and high climate change velocity overlap the areas of highest extinction risk (Finnegan et al. 2015), indicating a correlation between humans, climate change and extinction risk. The areas of overlap were mostly concentrated in the tropics and the subtropics. The tropics contain very high levels of biodiversity, providing habitat for unique species found nowhere else in the world. This is especially true for marine organisms. Conserving this diverse environment is important because of the many ecological services and economic benefits it provides.

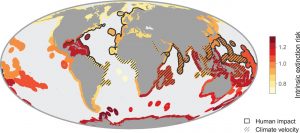
Hotspots of anthropogenic impact and velocity of climate change overlaid on mean intrinsic risk (Finnegan et al. 2015).

The term “global warming” has evolved into the term “climate change” because of the new understanding of the changes in overall climate (weather patterns, natural disasters, sea level rise, etc.), and not solely an increase in global temperatures. Climate change has a variety of extinction-inducing mechanisms including ocean acidification, anoxia (lack of oxygen) and global warming (Bond et al. 2017). The variability of these factors puts stress on organisms, causing them to migrate or to die out if they cannot adapt quickly enough. Thus, the coupled effects of climate change and human activity on highly diverse environments can cause increased extinction vulnerabilities among taxa (Finnegan et al. 2015). This possible loss of biodiversity and evolutionary potential must be taken seriously (Dawson et al. 2011).

Works Cited

Bambach, R. K., Knoll, A. H., & Wang, S. C. (2004). Origination, extinction, and mass depletions of marine diversity. Paleobiology, 30(4), 522-542.

Bond, & Grasby. (2017). On the causes of mass extinctions. Palaeogeography, Palaeoclimatology, Palaeoecology, 478, 3-29.

Carrasco, Marc A. (2013). The impact of taxonomic bias when comparing past and present species diversity. Palaeogeography, Palaeoclimatology, Palaeoecology, 372, 130.

Dawson, T., Jackson, S., House, J., Prentice, I., & Mace, G. (2011). Beyond Predictions: Biodiversity Conservation in a Changing Climate. Science, 332(6025), 53-58.

Doney, S. C., Ruckelshaus, M., Duffy, J. E., Barry, J. P., Chan, F., English, C. A., … & Polovina, J. (2011). Climate change impacts on marine ecosystems.

Finnegan, S., Anderson, S., Harnik, P., Simpson, C., Tittensor, D., Byrnes, J., . . . Pandolfi, J. (2015). Extinctions. Paleontological baselines for evaluating extinction risk in the modern oceans. Science (New York, N.Y.), 348(6234), 567-70.

Adaptation or Extinction: the Necessity of Fish Reproductive Acclimation in the Face of Climate Change

By Trish Albano, SRC intern

In an ever-changing marine environment, organisms must respond to their surroundings in order to remain reproductively successful.  However, with the current rate of climate change predicted to raise sea surface temperatures by approximately 3°C by the year 2100 (Collins et al., 2013), species are faced with a choice: shift geographic range or gradually adapt to changes cross-generationally.  In fishes, reproductive regulation and temperature are innately intertwined.  Changes in environmental temperature have the ability to impact the hypothalamo-pituitary-gonadal (HPG) axis in the reproductive system of many species of fish.  This gland controls the regulation of reproductive hormones necessary for reproductive success following a temperature cue.  In a study at James Cook University in Australia, researchers aimed to evaluate if there was a difference in gene expression in adult spiny chromis damselfish (A. polyacanthus) (Image 1) that had different reproductive capabilities as a result of developmental and transgenerational exposure to increased temperature (Veilleux, Donelson, & Munday, 2018).

Image 1. Study species: spiny chromis damselfish (A. Polyanthus). Species of damselfish from the West Pacific (Source: Wikimedia Commons)

Overall, this study’s goal was to assess the potential for reproductive plasticity in the face of increased temperatures. In order to assess if damselfish had partially acclimated reproductive capability, the researchers evaluated gene expression in the fish using a step-wise transgenerational temperature treatment (Donelson et al., 2016) (Figure 1).  It was hypothesized that the expression of reproductive genes would be down-regulated in damselfish who were exposed to the same high temperature levels as their parents.  However, it was also hypothesized that the expression of genes in the step-wise temperature treatment (parents exposed to +1.5°C, offspring exposed to +3.0°C) would be similar to that of the control group (no temperature increase) due to partial acclimation of the reproductive system in response to elevated temperature.

Figure 1. Experimental design of the study showing the control group (no transgenerational temperature increase), developmental (+3.0 degrees C in offspring), step-wise (+1.5 degrees C in parent, + 3.0 degrees C in offspring) and transgenerational (+3.0 degrees C in parent and offspring). Duration of the experiment is shown in the gray bars on the left. (Source: Veilleux, Donelson, & Munday, 2018).

After completing the experiment, it was found that the step-wise treatment group had a comparable proportion of pairs that reproduced to the control group.  On the other hand, pairs that were exposed to an immediate +3.0°C temperature increase (transgenerational and developmental) had fewer and no pairs reproducing successfully.  The results of this experiment support the researcher’s hypothesis that partial reproductive acclimation to elevated temperatures would lead to more reproductive success.  If climate change trends continue to result in increasing environmental temperature, maintaining reproductive success is key to marine species taking the adaptation approach versus changing geographic range.

Works cited 

Collins M, Knutti R, Arblaster J, Dufresne JL, Fichefet T, Friedlingstein P, Gao X, Gutowski WJ, Johns T, Krinner G, et al. (2013) Long-term climate change: projections, commitments and irreversibility. In Stocker TF, Qin D, Plattner GK, Tignor M, Allen SK, Boschung J, et al, eds. Climate Change 2013: The Physical Science Basis. Contribution of Working Group I to the Fifth Assessment Report of the Intergovernmental Panel on Climate Change. Cambridge University Press, United Kingdom and New York.

Crozier

Donelson JM, Wong M, Booth DJ, Munday PL (2016) Transgenerational plasticity of reproduction depends on rate of warming across gen- erations. Evol Appl 9: 1072–1081.

Veilleux HD, Donelson JM, Munday PL (2018) Reproductive gene expression in a coral reef fish exposed to increasing temperature across generations. Conserv Physiol 6(1): cox077; doi:10.1093/conphys/cox077.


Climate Change as Seen Through Atlantic Bluefin Tuna

By Olivia Schuitema, SRC intern

Climate change is the phenomenon in which global temperatures are rising due to an increase in the amount of CO2 in the atmosphere, largely resulting from burning fossil fuels and deforestation. The Earth’s ozone layer acts as a protective “blanket,” trapping warming greenhouse gases, such as CO2, in the Earth’s atmosphere. This “greenhouse effect” also affects the oceans; in the last 45 years, the mean ocean temperature in the upper 300m (where a majority of marine life live) has increased by 0.3°C (Muhling, 2011). Although this change seems small, even minor differences in temperature, salinity, and pH can affect organism and ecosystem success.

As atmospheric CO2 concentration increases, more CO2 dissolves into seawater and results in decreasing amounts of inorganic carbon in the ocean (Fraile, 2016). The inorganic carbon isotope is an important element in recycling nutrients throughout the ocean. Similarly, the ratio of stable oxygen isotopes in seawater can be related to the temperature and salinity of the water (Fraile, 2016), which can affect marine habitats. A recent study aiming to estimate CO2 uptake in the Mediterranean Sea over the past 20 years, suggests that evidence of climate change, spurring changes in the ratios of stable carbon and oxygen isotopes, can be seen in Atlantic bluefin tuna, Thunnus thynnus, otoliths. Otoliths are aragonite structures located in the inner ear of teleost fish that aid in balance and orientation (Fraile, 2016). As bluefin tuna age, they add new layers of aragonite on their otoliths, forming rings. The otolith layers are used similarly to ice cores and tree rings, in which they show environmental conditions, such as the amount of CO2, of the time period. In their first year of life, tuna are highly mobile and remain in surface waters of the Mediterranean Basin. Thus, the carbon and oxygen isotopes accumulated in the first year of life, shown in the central otolith layer (“otolith core”), are likely to reflect the seawater conditions of the Mediterranean Basin (Fraile, 2016).

Figure 1. The rings in fish otoliths can be used to determine fish age, NOAA

Researchers captured tuna of different sizes and measured their fork lengths (from the tip of the snout to the fork of caudal fin) in order to help determine their age. Otoliths were extracted from the tuna and cut in a cross-section to expose the otolith core (Fraile, 2016). Cores were powdered and analyzed for stable carbon and oxygen isotopes. Combining the anatomical age data and the otolith core data, a record of the annual amount of carbon and oxygen isotopes was compiled for the years 1989-2010. It was found that oceanic carbon and oxygen decreased in the studied years, inversely related to increasing atmospheric CO2 (Fraile, 2016). Decreasing amounts of inorganic carbon have negative impacts on biogeochemical cycling (cycling of nutrients, such as carbon, between the sediment, organisms and the water) in the ocean, leading to changes in environmental conditions. These changes could have cascading effects, affecting species on the organismal level and affecting populations throughout entire food chains.

Figure 2. Atlantic Bluefin Tuna, Thunnus thynnus, NOAA

Climate change can also lead to increasing ocean temperatures, which puts stress on marine organisms and causes degradation of marine habitats. Many fish, such as the Atlantic bluefin tuna, undergo physiological stress due to increase in seawater temperature, which impacts swimming abilities, spawning activities, egg hatching and larval growth (Muhling, 2015). A study conducted in the Gulf of Mexico and the Caribbean Sea aimed to gain further insight on the effects of climate change on tuna species through modeling systems (Muhling, 2015). Researchers applied ocean temperature fields with past and present data onto models of suitability (optimal conditions for survival) for the larval and adult stages of skipjack tuna and Atlantic bluefin tuna.

It was found that Atlantic bluefin tuna larva and adult survival decreased with increasing surface temperature (warmest temperatures in water column) and increased at deeper depths with cooler water (Muhling, 2015). This suggests that the temperate Atlantic bluefin tuna prefer to inhabit cooler waters and are negatively affected by warming temperatures. Conversely, tropical skipjack tuna larva and adults had higher survival rates at higher surface temperatures, indicating a preference for warmer temperatures. Future projections were also made, by using current tuna habitat suitability models with projected environmental trends due to climate change. By 2090, waters in the Gulf of Mexico will be highly unsuitable for both adult and larval stages of Atlantic bluefin tuna (Muhling, 2015). On the other hand, skipjack tuna adult and larvae suitability is projected to expand greatly, and possibly expand into bluefin tuna habitat in the future. As seen in this study, climate change can cause unbalanced changes in top predator ocean dynamics; some species like the skipjack tuna, thrive and have the potential to over dominate, while others, like the Atlantic bluefin tuna, are negatively impacted and can have a potentially reduced role in food webs.

Figure 3. Change in sea surface temperature 1901-2015, EPA

Global climatic patterns are also influenced by climate change. With increasing temperatures, there has been an increase in the frequency of droughts and heat waves (ex. California), and similarly, an increase in the number and intensity of hurricanes and tropical storms in the Caribbean (ex. Hurricanes Irma and Maria in 2017). According to a study conducted by analyzing Atlantic bluefin tuna vertical migrations with seasonal environmental conditions, tuna behavior is affected by ocean surface temperature (Bauer, 2017). During average seasonal temperatures, common bluefin tuna behavior involves periods of surfacing. However, data shows unusual deep diving intervals during thermal fronts, due to the increase in water surface temperature (Bauer, 2017).  Researchers hypothesize that increasing numbers of abnormal climate events can greatly affect the behavior of vertical migrators, such as sharks, sailfish and the Atlantic bluefin tuna (Bauer, 2017).

Rising global temperatures, largely due to anthropogenic influences, can cause a wide array of changes in the earth’s climate including extreme weather events, ocean acidification, and sea level rise. Systems in the marine environment, along with commercial and recreational fisheries, will also be adversely affected (Muhling, 2011). The effects of climate change will continue to intensify unless measures are taken to reduce the anthropogenic footprint on the earth.

References

Bauer, Fromentin, Demarcq, & Bonhommeau. (2017). Habitat use, vertical and horizontal behaviour of Atlantic bluefin tuna (Thunnus thynnus) in the Northwestern Mediterranean Sea in relation to oceanographic conditions. Deep-Sea Research Part II, 141, 248-261.

Fraile, Arrizabalaga, Groeneveld, Kölling, Santos, Macías, . . . Rooker. (2016). The imprint of anthropogenic CO2 emissions on Atlantic bluefin tuna otoliths. Journal of Marine Systems, 158, 26-33.

Muhling, Liu, Lee, Lamkin, Roffer, Muller-Karger, & Walter. (2015). Potential impact of climate change on the Intra-Americas Sea: Part 2. Implications for Atlantic bluefin tuna and skipjack tuna adult and larval habitats. Journal of Marine Systems, 148, 1-13.

Muhling, B. A., Lee, S. K., Liu, Y. T., & Lamkin, J. (2011). Predicting the effects of climate change on bluefin tuna (Thunnus thynnus) spawning habitat in the Gulf of Mexico. ICES Journal of Marine Science, 68(6), 1051-1062.

Declining Sea Ice: Impacts on Arctic Cetaceans

By Rachael Ragen, SRC intern

Climate change has had a major impact on Arctic waters especially since it is reducing and thinning sea ice. Anthropogenic greenhouse gas emissions have caused the temperature to increase by about 0.2 ºC and almost all of this heat is absorbed by the ocean (Hoegh-Guldberg and Bruno 2010). This negatively impacts the sea ice, which can be problematic for marine mammals since many behaviors are tied to seasonal ice conditions. In March of 1979 there was 16.5 million km2 of Arctic sea ice, but this number decreased to 15.25 million km2 by March of 2009 (Hoegh-Guldberg and Bruno 2010). There are many other effects due to the warming of the oceans. Thermal expansion occurs due to the lowered density of the warmer water causing sea levels to rise. Currents are based upon changes in density due to different temperatures of the water. These may change due to increased warming. The ocean also absorbs excess carbon dioxide from the atmosphere causing ocean acidification, which can have major effects on phytoplankton and zooplankton. This causes problems throughout trophic levels since these organisms make up the basis of many food webs.

Since sea ice is an important factor in the Arctic marine habitat, many marine mammals will experience changes in all aspects of their lives. Some of the most susceptible to these problems are endemic Arctic species such as the narwhal, as they are highly specialized and have trouble altering their habitat. Many other species are thought to shift northward as the temperature continues to increase (Wassmann et al. 2010). The metabolic rates of species also change with temperature and move out of their ideal range (Hoegh-Guldberg and Bruno 2010). The prey of Arctic cetaceans will also be affected by these changes causing a decrease in food and shifts in the food web. The major factor in all of this is sea ice considering the seasonal changes of ice structures the habitat of the marine environment and influences the organisms as well as photosynthetic processes, which have a major impact on the prey of the bowhead whale.

Figure 1: Bowhead whale, (Source: https://upload.wikimedia.org/wikipedia/commons/8/87/A_bowhead_whale_breaches_off_the_coast_of_western_Sea_of_Okhotsk_by_Olga_Shpak%2C_Marine_Mammal_Council%2C_IEE_RAS.jpg)

The bowhead whale is extremely adapted to thick sea ice and can move through nearly solid sea ice cover (Laidre et al. 2008). They rely on copepods and euphasiids but also eat zooplankton as well as pelagic and epibenthic crustaceans (Laidre et al. 2008). Phytoplankton have a specifically timed bloom when the sea ice begins to melt. Zooplankton then feed on these phytoplankton, but if sea ice decreases the water column will be warmed earlier causing the phytoplankton may bloom earlier. This will alter the interaction between zooplankton and phytoplankton possibly having very detrimental effects on the bowhead whale’s major food sources (Laidre et al. 2008).

Figure 2: Beluga (Source: https://c1.staticflickr.com/3/2598/3676156476_e01305bc09_b.jpg)

Belugas are connected with to pack ice and live in waters with a combination of open water, loose ice, and heavy pack ice. (Laidre et al. 2008) As species have a northward shift in their distribution, more predators such as the killer whale could move into the beluga’s habitat. Killer whales prey on narwhals and bowhead whales as well, but it is believed that belugas move into deep, ice-covered waters in order to avoid killer whales. (Laidre et al. 2008) If this ice disappears belugas could lose this protection and become much more susceptible to killer whales.

Figure 3: Narwhal, https://upload.wikimedia.org/wikipedia/commons/4/4e/Pod_Monodon_monoceros.jpg

Narwhals are thought to be the most susceptible of the Arctic cetaceans to changes in sea ice since they are endemic to the Arctic whereas belugas and bowhead whales have a circumpolar distribution (Wassmann et al. 2010). They are highly adapted to pack ice and most of their feeding occurs during winter months in waters with dense pack ice and limited open water. They mostly feed on benthic organisms (Laidre et al. 2008). Decreases or thinning in sea ice could alter their feeding habitats and be detrimental to their prey.

In the end changes in sea ice has many detrimental effects on Arctic cetaceans. As waters warm species are expected to shift northward because they are no longer in their ideal metabolic ranges and their habitats may no longer meet ecological needs (Laidre et al. 2008). Many species such as the humpback whale, minke whale, gray whale, blue whale, pilot whale, killer whale, and harbor porpoises may have altered migration patterns and arrive further north much earlier (Laidre et al. 2008). This will put these species in direct competition with narwhals, belugas, and bowhead whales. Predatory species such as the killer whale may also put more stress on these species due to increased predation. As habitat is lost or altered, the body condition of species will decline. This has a major impact both on cetaceans and prey species. Lowered body condition also makes organisms more susceptible to diseases and epizootics (Laidre et al. 2008). While the decrease in sea ice may initially benefit species like bowhead whales that feed on photosynthetic plankton, it will have unknown effects on the food web. The benefits will likely be short lived and become more detrimental to the habitat (Laidre et al. 2008).

References

Hoegh-Guldberg O, Bruno JF (2010) The impact of climate change on the world’s marine ecosystems. Science 328:1523-1528

Laidre KL, Stirling I, Lowry LF, Wiig O, Heidi-Jorgenson MP, Ferguson SH (2008) Quantifying the sensitivity of arctic marine mammals to climate-induced habitat change. Ecol Appl 18:97-125

Wassmann P, Duarte CM, Agustí S, Sejr MK (2011) Footprints of climate change in the Arctic marine ecosystem. Glob Chang Biol 17:1235-1249

Climate Change effects on sea turtles

By Molly Rickles, SRC intern

Climate change has become an increasing threat to species across the planet. With hotter average temperatures and less predictable weather patterns, humans have undeniably influenced the global climate. The effects of a changing climate are translated to the ocean, where warmer sea surface temperature and rising sea level can alter the marine ecosystem on many levels. These changes can decrease biodiversity and alter the balance of marine ecosystems (Fuentes et al. 2010). These far-reaching effects have extreme consequences for marine life, but some species are impacted more than others. Sea turtles are heavily affected by climate change because of their wide range of habitats (Butt et al. 2016). Since sea turtles lay eggs on beaches but spend their lives in the ocean, they are affected by climate change on both fronts. In addition, climate change may affect survival of juvenile sea turtles, decreasing adult population numbers. Since sea turtles can be widely affected by the far-reaching effects of climate change, it is necessary to implement measures of protection for them. There are ongoing research projects to determine how climate change directly impacts sea turtles and what the best policy options are to combat these effects. This is important because there is little information on how to protect these species from the effects of climate change.

In A, the mean air temperature is shown (black points) against the mean sand temperature (white points) to show how the temperature fluctuates throughout the year. In B, the proportion of nesting by loggerhead turtles for 2005, 2007, 2008, 2009. (Source: Perez, E. A., Marco, A., Martins, S., & Hawkes, L. (2016). Is this what a climate change-resilient population of marine turtles looks like? Biological Conservation, 193, 124-132. doi:10.1016/j.biocon.2015.11.023)

Over the past forty years, sea level has risen at an average of 2mm each year (Butt et al. 2010). This is an alarming statistic especially for low-lying and coastal areas. This is also bad news for sea turtles, which lay their eggs on beaches, which have already been affected by rising sea levels. Beaches are at a high risk for flooding from sea level rise, and when this does occur, the sea turtle eggs are washed away or swamped (Perez et al. 2016). This is especially devastating for endangered species of turtles such as the Hawksbill Turtle or the Australian Loggerhead Turtle, whose numbers are already low and cannot afford a sharp decrease in reproductive output (Butt et al. 2016).

Another major threat to sea turtles is rising sea surface temperature. One of the major effects of climate change is an increase in air temperature, which correlates to an increase in sea surface temperature. This excess thermal stress has especially hard consequences for reptiles, who are exothermic animals that rely on outside temperature to regulate their internal temperature (Perez et al. 2016). An increased sea surface temperature creates a more stressful environment for the sea turtles, but the increased sand temperature has proven to be even more harmful. Since sea turtles lay eggs on beaches, the hotter sand leads to less ideal conditions for laying eggs, which leads to decreased reproductive output. In addition, the sex of the embryos is partially determined by the outside temperature. In this case, a warmer environment leads to a higher percentage of females. It has been estimated that a 2°C increase will lead to a 99.86% female hatching rate (Butt et al. 2016). This, of course, will lead to a very lopsided sex ratio within sea turtle populations, further decreasing the reproductive output and population size.

The image shows all of the nesting sites identified in Australia. This shows that sea turtles have a wide range of habitats. This is beneficial because it allows policy makers to protect certain beaches where sea turtles are known to use for nesting. (Source: Butt, N., Whiting, S., & Dethmers, K. (2016). Identifying future sea turtle conservation areas under climate change. Biological Conservation, 204, 189-196. doi:10.1016/j.biocon.2016.10.012)

All of these threats to sea turtles could have devastating effects on their populations. Decreases in sea turtle populations have already been observed, and most sea turtle species are already on the endangered species list. Due to the fact that sea turtles are dealing with a multitude of threats, it becomes increasingly difficult to find management techniques to combat these issues (Fuentes et al. 2010). Some of the more straightforward strategies deal with the sea turtle’s habitat on land, since it is easier to manage beaches than the open ocean. Since sea turtles rely on certain beaches for nesting, it is possible to protect these areas to preserve the nesting habitat (Fuentes et al. 2010). This has already been implemented in many coastal areas, where nesting sites are blocked off from public use. In addition, many coastal areas have regulations to control nighttime lighting near nesting beaches so the sea turtle hatchlings have a better chance of making it to the ocean. By protecting these important nesting areas, sea turtles will continue to be able to lay eggs safely, and more hatchlings will survive to adulthood. This will lead to an increase in sea turtle population, thus preventing their numbers from decreasing even more rapidly.

In addition to managing habitat on land, it is also important to protect sea turtles in the ocean. One way to do this is to implement marine protected areas in important habitats for the turtles, such as areas where their young mature. However, the main issue affecting sea turtles is climate change, and this must be dealt with at a larger scale. To reduce the overall impact of climate change not only on sea turtles, but every other species, it is necessary to reduce the emissions of greenhouse gases and create a more sustainable way of life. There have already been steps made towards this goal, including the Paris Climate Accord, along with numerous clean air emission standards, but it is not enough. Stricter environmental regulations and environmental conservation education will help reach a more sustainable life, as well as protect sea turtles along with a multitude of other species

References

Fuentes, M., & Cinner, J. (2010). Using expert opinion to prioritize impacts of climate change on sea turtles’ nesting grounds. Journal of Environmental Management, 91(12), 2511-2518. doi:10.1016/j.jenvman.2010.07.013

Butt, N., Whiting, S., & Dethmers, K. (2016). Identifying future sea turtle conservation areas under climate change. Biological Conservation, 204, 189-196. doi:10.1016/j.biocon.2016.10.012

Perez, E. A., Marco, A., Martins, S., & Hawkes, L. (2016). Is this what a climate change-resilient population of marine turtles looks like? Biological Conservation, 193, 124-132. doi:10.1016/j.biocon.2015.11.023

Sea-ice loss boosts visual search: fish foraging and changing pelagic interactions in polar oceans

By Nicole Suren, SRC Intern

Light availability is one of the most important factors in the success of visual foraging. It can be controlled by many variables such as turbidity or weather, but in polar ecosystems ice cover and seasonality are the primary controls for light availability. Climate change has had and will continue to have a huge effect on polar ecosystems through temperature and weather changes, but one of the most notable side effects examined in this study is how increased light availability caused by receding ice and reduced snow cover will affect the success of polar visual foragers. The study modeled the success of planktivorous, visually foraging fish, with the underlying principle of the model being that increased ambient light will increase visual range, thereby making prey detectable at a larger distance and increasing foraging efficiency. The results showed that declines of polar sea ice would boost the visual search of planktivorous fish, but only seasonally. While light availability related to ice cover can be variable due to climate change, the long dark periods caused by polar seasonality are factors independent of climate, and therefore will still place limits on visual foraging during those seasons.

Figure 1

(a) The blue line shows how sea ice extent has decreased over the past decades, and below is a diagram demonstrating that prey will become more likely to be visually detected as the thickness of sea ice decreases. (b) A variety of factors influence prey detection, including the nature and angle of incoming light. Predator, prey, and visual range are not drawn to scale. (Langbehn & Varpe, 2017)

The models predict that several things will change due to light availability caused by loss of ice cover. First, primary productivity may increase, depending on nutrient availability. Second, seasonal feeding migrations into the poles are expected due to the removal of the limiting factor of lack of light for visual foragers. This prediction has already been verified by real-world data; increased feeding forays by Atlantic Salmon, Atlantic Mackerel, and Atlantic Herring have been recorded, and these coincide with decreasing ice cover over the past 35 years. More generally, mobile, fast-swimming predators are predicted to take advantage of these foraging opportunities the most. However, increased light availability can also increase the likelihood of planktivorous predators being spotted and predated upon by larger visual predators in a higher trophic level. This means that not only will the ideal user of these seasonal foraging grounds be mobile and fast-swimming, but they will either be apex predators or schooling fish, which can use the technique of schooling to forage in relative safety despite being visible.

Figure 2

The extent of sea ice is averaged from 2010-2015 in (a) and (b), and (c) and (d) show how visual range correlates with these averages. Data from the Bering Sea and the Barents Sea are shown. (Langbehn & Varpe, 2017)

No matter how efficiently visual foragers learn to take advantage of increased light availability at the poles during the summer months, the darkness of winter will still be a significant limiting factor in regards to permanent habitat expansion. Polar winters will always be long and dark, even if climate change alters the ice cover in that time. This means that the permanent inhabitants of the poles will likely remain the only permanent inhabitants due to their specialized adaptations for living in darkness, while trophic interactions are likely to change during the summer.

Work Cited

Langbehn, T. J., & Varpe, Ø. (2017). Sea-ice loss boosts visual search: Fish foraging and changing pelagic interactions in polar oceans. Global Change Biology, (November 2016). https://doi.org/10.1111/gcb.13797

Polar Bears are Vulnerable to Loss of Sea Ice

By Rachael Ragen

Figure 1

Polar Bear, https://sealevel.nasa.gov/ system/news_items/main_images/ 74_polarbear768.jpeg

Polar bears are currently facing a major problem: declining sea ice. As greenhouse gases continue to increase due to anthropogenic factors causing temperatures to rise and ice to melt. Since polar bears rely on sea ice as they search for prey, the decline in sea ice makes hunting much more difficult. The current population of polar bears is estimated to be 26,000 with 19 subpopulations in 4 ecoregions (Figure 2). It is very difficult to properly assess each subpopulation of polar bears as they live in extreme environments. Therefore, no global assessment has been done and the status of some subpopulations is unknown. The study by Regehr et al. aimed to look at the effect of sea ice decline on polar bears by determining the generation length, forming a standardized sea ice metric, and then using statistical models and computer simulations.

Figure 2

Map of Ecoregions, Regehr et al.

In order to determine the generation length, the authors looked at the age of female polar bears with a cub and found the average to be 11.5 to 13.6 years. Live capture data was used to determine these numbers. The upper level is used to account for variations in generation length.

A sea ice metric was determined using satellite data from 1979 to 2014. This data was used to establish the carrying capacity, which is the maximum amount of organisms the habitat can support, for the polar bears. Then the value found for K (carrying capacity) was used in linear models. This analysis generated predicted future values of ice as well, as the effect these values had on subpopulations. The ice decline was shown to affect all subpopulations.

The statistical models and computer simulations looked at the relationship between polar bear populations and sea ice over three generations using three different methods. First they assumed that changes in sea ice are directly proportional to changes in subpopulation abundance. This method was useful for populations with limited data. Second they looked at a linear relationship between ice and subpopulation abundance for subpopulations, although data was only available for seven of the nineteen. There was not shown to be a significant change due to variations in the status subpopulations as well as uncertainty in estimates of abundance. Lastly they again looked at a linear relationship between ice and population but for each of the four ecoregions. Some ecoregions showed a significant change, whereas others did not, showing that dynamics and biological productivity varies between subpopulations.

Figure 3

Table of data found, Regehr et al.

This study looked at the IUCN Red List’s guidelines for risk tolerance. The culmination of these studies showed that the first generation’s mean global population size was to decrease by 30%, the second by 4%, and the third by 43% (Table 1). Since there was shown to be a high risk of the population decreasing by 30% and a low chance of the population decreasing by 50% (Table 1), polar bears are classified as vulnerable.

Snook in Extreme Environments

By Delaney Reynolds, SRC Intern

Earth’s climate is warming, and rising temperatures are impacting animal species and their habitats in alarming ways. Since 1970, temperatures have increased approximately 0.17°C (0.3°F) per decade (Dahlman, 2017). Such changes threaten animals’ ability to adapt to increased heat and induced stress. In the article, “Can animal habitat use patterns influence their vulnerability to extreme climate events? An estuarine sportfish case study,” researchers observed how migration patterns impacted species’ vulnerability to extreme climate events (ECEs), episodes of uncommon climactic periods in which ecosystem structure is transformed beyond what is characteristically normal (Smith, 2011).

Figure 1: Juvenile Snook

A Juvenile Common Snook caught in the Everglades National Park. Image Source: https://www.nsf.gov/news/mmg/mmg_disp.jsp?med_id=132218&from=mn

The State of Florida enjoys mild lows of 65-41°F during its winter season. Extreme cold fronts, however, occur approximately once every 10 years and can result in colder, more fatal environmental systems. During extreme cold fronts, South Florida’s Everglades National Park often experiences dramatic declines in sportfish populations and, thus, is the experimental ground used to study Snook and climate vulnerability. In 2010, for example, the Park faced one of its most severe cold fronts in a century and saw imperative tropical fisheries decrease 80%.

One of the Park’s residents, the Common Snook, has been useful in studying climate vulnerability because, “the abundance of adult Snook, the most sought after gamefish in the area, decreased by over 90% following the passage of this event” (Boucek, 2017). Once water temperature drops below 60°F, the Snook begin to struggle and become particularly vulnerable.

Looking at Everglades estuaries, Common Snook are observed in various cold-temperature regions. Snook often reside in rivers and for this reason three distinctive areas of the Everglades’ Shark River estuary were studied: the upstream, bay, and downstream zones. The downstream zone consists of the most Snook predators, but also the most Snook prey, and so Snook population and productivity is relatively higher compared to the upstream and bay zones. Passive acoustic telemetry computed Snook distribution patterns predicted for 2012 to 2016 during ECE periods. The researchers found that downstream zones were found to be the warmest, causing little effect on Snook populations, and upstream zones the coldest, killing most tropical fish. When a cold spell is detected in high vulnerability communities, most fish species migrate to areas of higher resistance, ensuring a higher survival rate. When it came to dispersing among less vulnerable habitats, Snook did not portray migration tendencies when detecting ECEs. Another study during the 2010 ECE found that most Everglades Snook showed the same behavior and did not move long distances, but rather made short journeys to areas that would function as a refuge from less severe, but more frequent ECEs (Stevens, 2016).

Figure 2: Snook Habitat Resistance, Animal Distribution, Detection and Response

This figure demonstrates animal distribution in high and low resistance environments, the shaded shapes, as well as their response to ECEs. As shown on the right, when a cold spell is detected in low vulnerability communities, fish will migrate to areas of higher resistance (shown in bright green) and return to their original habitat once it has passed, ensuring a higher rate of survival among the population. Image Source: Can animal habitat use patterns influence their vulnerability to extreme climate events? An estuarine sportfish case study.

Snook face higher risk of population degradation when they are unable to immigrate to congenial territories, yet their populations did not face large casualties due to the ECEs because they tend to typically dwell in the warmer downstream zone. By staying in warm water areas, the Common Snook helps us better understand how species respond to a change in their habitats’ climate. As ECEs become more common and severe it will be vital to continue to monitor fisheries so as to learn how our warming climate impacts species and their habitats.

Works Cited

Boucek, R. E., Heithaus, M. R., Santos, R., Stevens, P., & Rehage, J. S. (2017, April 7). Can animal habitat use patterns influence their vulnerability to extreme climate events? An estuarine sportfish case study. Retrieved from file:///C:/Users/derey/Downloads/boucek%20et%20al%202017b.pdf

Dahlman, L. (2017, September 11). Climate Change: Global Temperature. Retrieved October 22, 2017, from https://www.climate.gov/news-features/understanding-climate/climate-change-global-temperature

Smith, M. D. (2011, April 15). An ecological perspective on extreme climatic events: a synthetic definition and framework to guide future research. Retrieved from http://onlinelibrary.wiley.com/doi/10.1111/j.1365-2745.2011.01798.x/abstract

Effects of Climate Change on the invasive Lionfish: Pterois volitans and Pterois miles

By Patricia Albano, SRC intern

Across the globe, marine environments face anthropogenic stressors that threaten their continued survival. Throughout the world’s oceans, a colorful variety of marine communities exist, each with their own native flora and fauna and unique interspecific and intraspecific interactions. When the balance of these ecosystems is altered, negative ecological impacts can follow. The introduction of invasive species into marine communities in which they do not belong can have significant and long-lasting effects on the health, balance, and abundance of native species in the environment (Carlton, 2000). A well-known culprit, the Indo-Pacific lionfish, Pterois volitans or Pterois miles, has invaded the Western Atlantic ocean where it voraciously preys upon native species and reproduces in abundance. Via the reports of various divers, researchers, and fishing operations, it has been determined that the lionfish distribution along the east coast of North America may span from the Florida Keys to Cape Hatteras, North Carolina and include water depths up to 100m (Whitfield et al., 2002). For such invasive species to thrive in non-native ecosystems, several environmental factors come into play, one of the most notable being climate change. It has already been noted that increasing global ocean temperatures can predictably influence the growth and reproduction of marine fish and invertebrates (Brown et al., 2004). Consequently, increased growth and reproduction rates can directly impact population increases. For native species, this would be less of a concern; however, with the destructive influence that invasive species propose, it has become an epidemic. All of this considered, it can be concluded that climate change likely propagates invasions rather than halting them, especially in the case of lionfish (Côté and Green, 2012).

Indo-Pacific Lionfish: Pterois volitans. Popular in the aquarium trade for their superfluous body shape and coloration, Indo-Pacific lionfish pose a threat to invaded areas due to their voracious appetite and extreme reproductive capacity.  Image source: Wikimedia Commons

Indo-Pacific Lionfish: Pterois volitans. Popular in the aquarium trade for their superfluous body shape and coloration, Indo-Pacific lionfish pose a threat to invaded areas due to their voracious appetite and extreme reproductive capacity. Image source: Wikimedia Commons

After being introduced into coastal Florida waters in the 1980s through the aquarium trade, the Indo-Pacific lionfish has taken over the entire Caribbean basin and much of the Western Atlantic, infiltrating coral reefs, seagrass beds, and mangrove communities. It is predicted that lionfish life-history and behavior are intrinsically temperature-dependent based on observations of their reproduction and diet (Côté and Green, 2012). In a study concerning the effects of warming temperature on lionfish pelagic larval duration and dispersal and predation rate, it was found that increased temperatures set the perfect stage for an invasion to thrive. Due to their generalist diet, ability to expand their introduced range, and high fecundity, lionfish will continue to remain a threat in the Western Atlantic (Côté and Green, 2012). Increased temperature was predicted to drive the present imbalance between prey consumption and production rates, resulting in the lionfish having the upper hand in the ordeal. As oceans continue to warm, the lionfish will be able to expand its range to areas that are currently too cold for their inhabitation, specifically as the 10°C isotherm expands north and south in both of the hemispheres (Morris and Whitfield, 2009; Côté and Green, 2012). Finally, lionfish spend less time in the pelagic larval stage with increased ocean temperature, leading to growth of populations as temperatures continue to rise (Côté and Green, 2012).

Temperature anomaly of average global sea surface temperature from 1880-2015.  This increased warming trend is predicted to continue and proceed to facilitate the lionfish invasion into regions further north and south of the equator. Figure source: United States Environmental Protection Agency (https://www.epa.gov/climate-indicators/climate-change-indicators-sea-surface-temperature)

Temperature anomaly of average global sea surface temperature from 1880-2015. This increased warming trend is predicted to continue and proceed to facilitate the lionfish invasion into regions further north and south of the equator. Figure source: United States Environmental Protection Agency (https://www.epa.gov/climate-indicators/climate-change-indicators-sea-surface-temperature)

According to the National Ocean and Atmospheric Administration (NOAA), average global sea surface temperature has risen at an average rate of 0.13°F per decade since 1901 (Figure 1). Although this may seem like an insignificant increase, at this rate, global average sea surface temperature is predicted to hover around a 1°F anomaly from historical average by the year 2020, and steadily increase from there. With these elevated sea water temperatures, lionfish will continue to capitalize on climate change if this pattern is not halted. For the time being, one of the only limiting factors that the lionfish invasion faces is the fish’s intolerance to minimum water temperatures of some of its extended ranges away from the equator during the winter time (Kimball et al., 2004). However, this temperature anomaly pattern could facilitate expansion of the depth and latitude range of these invaders. In a study conducted on thermal tolerance and potential distribution of lionfish, it was found that the mean chronic lethal temperature for lionfish was 10°C and mean temperature for them to cease feeding was 16.1°C (Kimball et al., 2004). The average temperature for Florida waters during the winter time is 22°C and about 10°C at the northern limit that lionfish range, Cape Hatteras. These average water temperatures and this study show that as water temperatures continue to increase, the range of lionfish will continue to expand.

Overall, it can be deduced that climate change proposes a large threat to marine communities, especially where invasive species are concerned. As temperatures continue to rise above the norm, lionfish will extend their invasion further along the Western Atlantic.

Works Cited

Brown JH, Gillooly JF, Allen AP, Savage VM, West GB, 2004. Toward a metabolic theory of ecology. Ecology 85: 1771–1789.

Carlton JT, 2000. Global change and biological invasions in the oceans. In: Mooney A, Hobbs RJ ed. Invasive Species in a Changing World. Covelo, Calif ornia: Island Press, 31–53.

Côté IM, Green SJ (2012) Potential effects of climate change on a marine invasion: The importance of current context. Curr Zool 58:1–8

Kimball ME, Miller JM, Whitfield PE, Hare JA (2004) Thermal tolerance and potential distribution of invasive lionfish (Pterois volitans/miles complex) on the east coast of the United States. Marine Ecology Progress Series 283:269–278

Morris JAJ, Whitfield PE, 2009. Biology, ecology, control and management of the invasive I ndo-Pacific lionfish: An updated integrated assessment. NOA A Technical Memorandum NOS NCCOS 99.

Whitfield PE, Gardner T, Vives SP, Gilligan MR, Courtenay WR, Jr., Ray GC, Hare JA (2002) Biological invasion of the Indo-Pacific lionfish Pterois volitans along the Atlantic coast of North America. Mar Ecol Prog Ser 235:289–297


Implications of climate change for the sex ratios of sea turtle hatchlings

By Grace Roskar, SRC Intern

Sea turtles have existed on Earth for over 100 million years and presently inhabit warm waters in tropical and subtropical latitudes. The International Union for the Conservation of Nature has classified six of the seven species of sea turtles as critically endangered, endangered or vulnerable (IUCN, 2014 in Laloë et al., 2016). Threats to sea turtles include being taken as bycatch from fishing, poaching of eggs, and destruction of their habitats on land or at sea. Moreover, all sea turtle species come ashore to lay their eggs on sandy beaches, but these critical habitats face changes in air, water, and sand temperatures and rising sea levels (Santos et al., 2015). These climatic impacts occur at varying timescales and in different geographic locations, which makes it more challenging to respond to and mitigate these various threats (Fuentes and Cinner, 2010).

Like many reptiles, sea turtles possess temperature-dependent sex determination (TSD), which means that the incubation temperature of eggs in the nest determines the sex of an individual. Each species has a certain threshold, or pivotal, temperature, where equal numbers of males and females are produced. Temperatures below this pivotal temperature produce males whiles temperatures above produce females (Standora and Spotila, 1985). The determination of sex occurs in the middle third timeframe of the development of the embryo (Tapilatu and Ballamu, 2015). Due to TSD, increasing temperatures are a concern to sea turtles and were recently determined to be one of the largest threats to sea turtle populations (Fuentes and Cinner, 2010). Sex ratios could become skewed, and in more extreme cases, local extinctions could occur (Janzen, 1994 in Laloë et al., 2016). Warmer nest temperatures may lead to a greater majority of female hatchlings (Howard, Bell and Pike, 2015). Determining what ways increasing temperatures can impact populations is a priority for the conservation of sea turtles (Laloë et al., 2016).

In one study, Fuentes and Cinner (2010) used the knowledge of sea turtle experts to estimate how increasing temperatures and other climatic processes will impact sea turtles’ reproductive phases. The turtles of interest were green turtle (Chelonia mydas) populations in the northern Great Barrier Reef of Australia. Twenty-two scientists and managers were surveyed, and both groups agreed that higher sand temperatures could be considered the biggest threat to the reproductive output of these populations. The experts believe that higher sand temperatures will cause “two times more impact to sea turtles’ reproductive output than sea level rise and three times more impacts than altered cyclonic activity” (Fuentes and Cinner, 2010).

However, studies have also showed certain levels of resilience in some sea turtle populations. Howard, Bell, and Pike (2015) studied flatback sea turtles (Natator depressus) that are only native to Australia. Eggs were incubated in a laboratory to examine if the population was vulnerable to higher temperatures while nesting. The eggs were collected from beaches in northeastern Australia, and thus their pivotal temperatures were compared to those of populations from more temperate latitudes in Australia. It was found that the embryos in their study were resilient to incubation at high temperature, able to withstand temperatures almost 4°C above those from more southern populations. Moreover, the pivotal sex-determining temperature was different from past studies. It was previously thought that 29.5°C would produce an equal sex ratio, but for the eggs in this study, 30.4°C was the pivotal temperature. With a higher pivotal temperature, increasing environmental temperatures could drive the sex ratios closer towards equality. Therefore, even under extreme climate change scenarios, this high pivotal temperature adaptation may allow some flatback turtle populations to still produce more equal sex ratios (Howard, Bell, and Pike, 2015).

Not all sea turtle populations have shown such resilience. Fuentes, Hamann, and Limpus (2010) studied sand and air temperatures in the northern Great Barrier Reef. By using models and projections, it was estimated that by 2030, the sex ratios of hatchlings will be greatly skewed towards females. This has also been predicted for other nesting sites such as Cape Canaveral, Florida, and Bald Head Island, North Carolina (Hawkes et al 2007 in Fuentes, Hamann, and Limpus 2010). Laloë et al. (2016) examined historical data for incubation temperatures and sex ratios for green, hawksbill (Eretmochelys imbricata), and leatherback (Dermochelys coriacea) turtles nesting in St. Eustatius in the northeastern Caribbean. Their analysis suggested sex ratios have been skewed towards females for decades, and climate change will only intensify this. It was projected that in St. Eustatius “only 2.4% of green turtle hatchlings will be males by 2030, 1.0% by 2060, and 0.4% by 2090,” (Laloë et al., 2016). Sex ratios dominated by females have already been reported at nesting sites around the world (e.g. Barbados, Cyprus) and at certain sites, some ratios are as high as 100% female (Binckley et al., 1998 in Laloë et al., 2016).

Projections of increasing incubation temperatures at one site in St. Eustatius. Graph A shows projections for 2030, graph B shows 2060, and graph C shows 2090 (Laloë et al., 2016).

Projections of increasing incubation temperatures at one site in St. Eustatius. Graph A shows projections for 2030, graph B shows 2060, and graph C shows 2090 (Laloë et al., 2016).

Sea turtles have existed for millions of years and have previously shown the ability to adapt during periods of sea level rise and temperature changes, such as changing nesting site locations or utilizing new migratory paths (Fuentes, Hamman, and Limpus 2010). However, modern-day changes in climate have been predicted to occur at a much faster timescale than past changes. Therefore, the capabilities of sea turtles adapting to these changes are still fairly unknown (Fuentes, Hamman, and Limpus 2010). There are several management options that have been suggested in order to mitigate the effects of higher temperatures. Some active methods include artificially changing the sand temperature by sprinkling cool water on the sand, covering areas of the beach with vegetation, or creating artificial shade (Naro-Maciel et al., 1999 in Fuentes, Hamman, and Limpus 2010). Other methods include the use of hatcheries and artificial incubation where temperatures can be controlled, but there is still uncertainty about the risks associated with changing natural sex ratios. Management could also be aimed at population-wide measures, including protecting key habitats, reducing bycatch of sea turtles, and preventing illegal harvest (Fuentes and Cinner, 2010).


A table outlining possible management measures to reduce climate change impacts on sea turtle reproduction, provided by experts surveyed in the study by Fuentes and Cinner (2010).

A table outlining possible management measures to reduce climate change impacts on sea turtle reproduction, provided by experts surveyed in the study by Fuentes and Cinner (2010).


Sea turtles have key roles in the ecological function of marine ecosystems, as they help maintain seagrass beds and are a valuable part of the tourism industry for many nations. It is vital to understand how the changing environment will influence risks for current and future sea turtle populations around the world. Minimizing further anthropogenic impacts, conserving existing populations and habitats, and further investigation of sea turtles’ ability to adapt to increasing temperatures is critical to protecting these marine organisms.


References:

Howard, Robert, Ian Bell, and David Pike. “Tropical Flatback Turtle (Natator Depressus) Embryos Are Resilient to the Heat of Climate Change.” Journal of Experimental Biology 218 (2015): 3330-335. Web. 1 Feb. 2016.

Fuentes, M.M.P.B., and J.E. Cinner. “Using Expert Opinion to Prioritize Impacts of Climate Change on Sea Turtle’s Nesting Grounds.” Journal of Environmental Management 91 (2010): 2511-518. Web. 1 Feb. 2016.

Laloë, Jacques-Olivier, Nicole Esteban, Jessica Berkel, and Graeme Hays. “Sand Temperatures for Nesting Sea Turtles in the Caribbean: Implications for Hatchling Sex Ratios in the Face of Climate Change.” Journal of Experimental Marine Biology and Ecology 474 (2016): 92-99. Web. 1 Feb. 2016.

M.M.P.B. Fuentes, M. Hamann, and C.J. Limpus. “Past, Current and Future Thermal Profiles of Green Turtle Nesting Grounds: Implications from Climate Chang.” Journal of Experimental Marine Biology and Ecology 383 (2010): 56-54. Web. 1 Feb. 2016.

Santos, Katherine Comer, Marielle Livesey, Marianne Fish, and Armando Camago Lorences. “Climate Change Implications for the Nest Site Selection Process and Subsequent Hatching Success of a Green Turtle Population.” Original Article Mitigation and Adaptation Strategies for Global Change (2015): n. pag. Web. 1 Feb. 2016.

Standora, Edward A., and James R. Spotila. “Temperature Dependent Sex Determination in Sea Turtles.” Copeia 1985 (1985): 711-22. Web. 1 Feb. 2016.

Tapilatu, Ricardo F., and Ferdiel Ballamu. “Nest Temperatures of the Piai and Sayang Islands Green Turtle (Chelonia Mydas) Rookeries, Raja Ampat Papua, Indonesia: Implications for Hatchling Sex Ratios.” Biodiversitas 1st ser. 16 (2015): 102-07. Web. 1 Feb. 2016.