Are Polar Bears on Thin Ice?

By: Kaylie Anne Costa, SRC Intern

When you think of polar bears what comes to mind? Is it a mama bear and a cub struggling to swim miles to find a piece of sea ice? Because that is exactly what is beginning to occur in the Arctic. With the rise of the sea surface temperatures, more and more sea ice is thawing causing the polar bears breeding and hunting grounds as well as means for transportation to disappear.

Figure 1: Polar bears using sea ice for transportation (By NOAA Photo Library – anim0115, Public Domain, https://commons.wikimedia.org/w/index.php?curid=17942736)

Polar bears have a varied diet consisting of seals, birds, fish, whales, and other marine resources. They also utilize a mixture of hunting methods. For example, polar bears may stalk seals in the open ocean or sneak up on seals that are drifting on sea ice. When there is not sea ice, polar bears must rely much more heavily on their swimming skills for transportation and hunting.

In a recent study, Lone et. al (2018) studied the time that female polar bears spend in the water to gain understanding as to how polar bears might react to future decreases in Arctic sea ice. 57 adult polar bears were tagged with devices to gather data on their locations, the amount of time spent swimming, and the diving depths. This study showed that polar bears’ choice of hunting strategies, and therefore amount of swimming, greatly depends on the individual. In addition, environmental factors and if the females had cubs also impacts the time a polar bear spends swimming. Polar bear cubs lack the thick layer of fat that insulates their bodies leaving them more susceptible to hypothermia. As a whole, the main variable that influence the swimming behaviors of the polar bears was the seasonal variation in sea ice. The most swimming occurred in summer and fall with less swimming occurred during the winter and spring. Modeling techniques were also used to correlate increased swimming with decreased levels of sea ice.

Figure 2: Polar bear swimming (https://commons.wikimedia.org/wiki/File:Polar_bear_arctic.JPG)

Overall the polar bears appeared well adapted to arctic marine environments and were able to complete long distance swims and dive greater than 10 meters. As sea ice continues to disappear, more polar bears will be required to alter their choices of hunting strategies to adapt to the new environment. This study shows promise in polar bears’ ability to adapt to reduced sea ice, at least to a certain extent. Further studies will need to be completed to analyze the impacts that additional swimming behavior will have on the polar bears health overall.

Works Cited

Lone, K., Kovacs, K. M., Lydersen, C., Fedak, M., Andersen, M., Lovell, P., & Aars, J. (2018). Aquatic behaviour of polar bears (Ursus maritimus) in an increasingly ice-free Arctic. Scientific reports8(1), 9677.

The Importance of Horizon Scans for Finding Emerging Conservation Issues

By: Molly Rickles, SRC Intern

Often times, there are many conservation issues that go unnoticed because the general public and government are focusing on larger, more easily accessible issues. However, this doesn’t mean that the smaller, more localized conservation issues aren’t important. Horizon scans of emerging issues brings to light some of these other equally important situations. To determine the most pressing issues that aren’t receiving enough attention, the authors of this study first identified possible topics, which resulted in an original search of 91 topics. Then, they circulated the list to participants who ranked the topics based on their awareness of the topic. This narrowed down the list to 15 topics that are presented in this paper. All of the topics presented are assumed to be low knowledge areas of study, and topics that need attention due to their urgency or potential magnitude (Figure 1). While the topics range from Antarctic ice loss to the use of salt tolerant rice, some general similarities and observations can be drawn. While many of the issues focus on finding sustainable solutions, it is highlighted that even these ‘better’ alternatives can still have negative environmental effects. This shows the need for more research and environmental impact assessments before implementing alternative solutions to common problems, because the effects can be negative even if the solution is perceived to be more sustainable.

Figure 1: This image shows the Qinghai-Tibet Plateau in China, which is where China is building new irrigation canals that could have devastating environmental impacts (source: https://www.panoramio.com/photo/56563318.)

Another general observation is that powerful governments, such as the US and China, have the ability to implement policy that has global environmental impacts. For example, one of the highlighted topics was the use of new irrigation canals in China for farming that would destroy multiple ecosystems without the use of an environmental impact assessment. This could have far reaching effects for the health of the river system that travels beyond China’s boundaries (Figure 2). This fact is also highlighted by the US government’s decision to withdraw from the Paris Climate Agreement. Since the US will not be following the set emission standards, the health of the global environment will be affected.

Figure 2: This image shows the methodology used by the authors. The authors started with a large sample size and narrowed it down by surveys and in person meetings to determine the most relevant topics to be used in the horizon scan.

A reoccurring theme throughout the topics was new agricultural technology. The authors suggested that this might hint at the urgency among scientists of meeting food demands, which is becoming an important issue. While such new technology would be advantageous if it improved food availability, new technology is not always monitored or regulated. This can cause detrimental environmental impacts.

These horizon scans of environmental issues are important for bringing light to less well-known conservation problems. All of the topics are considered to be low awareness, but with enough research involved to show it can be plausible. Bringing these issues to the public’s attention is extremely important to raise awareness and make sure that the best solutions are being implemented to create a more environmentally conscious global community.

Work Cited:

Sutherland, W. J., Broad, S., Butchart, S. H., Clark, S. J., Collins, A. M., Dicks, L. V., . . . Gaston, K. J. (2019). A Horizon Scan of Emerging Issues for Global Conservation in 2019. Trends in Ecology and Evolution.

Impact of Multiple Stressors on Sea Bed Fauna in a Warming Arctic

By: Brenna Bales, SRC Intern

The Arctic Ocean has been a heavily monitored area in recent years as climate change continues to affect the planet. This area is at high risk due to the fact that is has warmed at almost twice the rate as the rest of the planet in recent decades causing a decrease in sea-ice cover, glacial volume, and increases in temperature and precipitation (Hassol and Corell 2006). The Barents Sea is particularly vulnerable to climate change as it is experiencing the greatest temperature increases throughout the Arctic and may soon become an Atlantic-dominated climate region with warm and well-mixed waters, further preventing sea ice formation (Lind et al. 2018). Jørgensen et al. (2019) examined the Barents Sea benthic (seafloor) composition and how it has been affected by several stressors relating to climate change. Ecological impacts among the benthic environment were examined as a result of seawater warming, bottom trawling, and predation from a new, invasive predator: the snow crab (Figure 1).

Figure 1: Two snow crabs along the seafloor, a larger male above and a smaller female below. Image Credit: Derek Keats, Johannesburg, South Africa

The study characterized the vulnerability of different invertebrate groups when affected by these three variables across a predefined grid consisting of 36 x 36 nautical mile cells in the Barents Sea (Figure 2). Firstly, sensitivity to seawater warming between 2009-2011 (colder period) versus 2012-2015 (warmer period) was investigated. Both species temperature indices (a measure of the average temperature experienced by individuals across a species’ range) and community temperature indices were calculated by combining temperature values with information about the seafloor organism distribution. Secondly, species vulnerability to bottom trawling (Figure 3) was characterized by a species’ morphology, mobility, and body size. Slower, larger, and taller animals were categorized as having a larger susceptibility to trawling effects, whereas quicker, smaller animals would be more resilient. Lastly, the predatory effects of the invasive snow crab were quantified by number of prey items and annual biomass (amount of prey) consumed.

Figure 2: Geographic location of the Barents Sea with the 2280 sampling locations from the present study (Jørgensen et al. 2019).

Figure 3: Depiction of the practice of bottom trawling (Source: NOAA.gov).

From the initial, colder period (2009-2011) to the latter, warmer period (2012-2015), there was an increase in organisms with warm-water affinities and a reduction in those with cold-water affinities. While the overall sensitivity to temperature of the communities decreased with time, areas that were further north into the Arctic showed a higher vulnerability to temperature changes than more southern areas continuously experiencing warming waters. The sensitivity to trawling was lowest in the center region of the Barents Sea and increased toward outer regions. Lastly, the sensitivity to snow crab predation was highest along the northwestern border connecting to the southeastern border of the study area. Overall, the northwestern area of the Barents Sea was found to be the most vulnerable area when all three variables were combined. In conclusion, the combination of multiple stressors in any particular area can have severe consequences on the resilience of a local community to change. Management in the form of closed areas or gear modification is thus highly recommended by researchers from this paper to lessen the threats that these communities, especially those of the northwestern Barents Sea, are facing.

Work Cited:

Hassol, S.J. and Corell, R.W., 2006. Arctic climate impact assessment. Avoiding dangerous climate change, p.205.

Jørgensen, L.L., Primicerio, R., Ingvaldsen, R.B., Fossheim, M., Strelkova, N., Thangstad, T.H., Manushin, I. and Zakharov, D., 2019. Impact of multiple stressors on sea bed fauna in a warming Arctic. Marine Ecology Progress Series608, pp.1-12.

Lind, S., Ingvaldsen, R.B. and Furevik, T., 2018. Arctic warming hotspot in the northern Barents Sea linked to declining sea-ice import. Nature Climate Change8(7), p.634.

Functional Group Analysis Provides Insight in to Changes in Ecological Communities

By: Carolyn Hamman, SRC Intern

The interaction and impact humans have with and on oceanic environments are difficult to measure yet of vital importance to understand. The increasing global demand for fish as a food source has led to fishing pressures with potentially detrimental effects on the fished communities. By understanding the changes that are occurring within these ecological communities, conservation measures can be proposed to protect the habitat from becoming irreversibly changed. The caveat is the many environmental factors and interactions within and among certain communities which makes it hard to accurately predict impacts from fishing pressure.

Prior methods have included looking at measurements, such as species richness, as a proxy for community changes (Bremner, 2008). However, this ideology might not be as applicable within environmentally variant communities. Instead, there is a new approach that groups populations with certain like traits together. These groups, called functional groups, share response and effect traits. These traits capture how well the groups will survive based on different environmental conditions as well as the effect the same group has on other organisms and the overall ecosystem (Lundquist et al., 2018). This method of analyzing ecosystem impacts is advantageous as it standardizes responses certain individuals might have as well as looking at responses that are actually relevant to the ecosystem (Lundquist et al., 2018).

An example of this approach in action occurred in a study looking at the approach of bottom fishing disturbance on benthic communities in New Zealand (Figure 1). Here, researchers split the species in the area in to eight functional groups based on the way said species interact and modify their environment, and hypotheses were made on how fishing would disturb each functional group based on their characteristics (Lundquist et al., 2018).

Figure 1: An image of the New Zealand exclusive economic zone (EEZ) (Source: http://www.mfe.govt.nz/publications/marine/offshore-options-jun05/html/figure-1.html).

The scientists looked at the abundance of each functional group as a function of different categories of certain parameters including depth, seabed roughness, sediment, seabed slope, tidal current, primary productivity, and fishing effort. The results from the analysis showed how effective using functional groups was as a proxy for predicting the impact seafloor trawling has on disturbing the benthic communities in New Zealand (Lundquist et al., 2018). Each functional group had different responses to each variable based on how the group interacts with their environment. Even with increased fishing effort, some functional groups had an increase in abundance, which would allow them to radiate as other functional groups decreased in abundance.

Figure 2: Abundance of each functional group for the Ocean Survey 20/20 offshore dataset for different fishing effort classes. Abundance values for groups 4 and 6 are plotted on the secondary y axis. Error bars represent one standard error. (Lundquish et al., 2018)

Using functional groups as a method to analyze changes in ecological communities provides a more holistic and accurate way to look at how ecosystems change as a result of different parameters, including fishing effort. Having a more accurate picture of the changes allows scientists to be able to implement more robust protocol that will protect the ecosystem for the future.

Works cited:

Bremner, J. (2008). Species’ traits and ecological functioning in marine conservation and management. J. Exp. Mar. Biol. Ecol. 366, 37–47.

Lundquist, C. J., Bowden, D., Cartner, K., Stephenson, F., Tuck, I. & Judi E. H. (2018). Assessing Benthic Responses to Fishing Disturbance Over Broad Spatial Scales That Incorporate High Environmental Variation. Frontiers in Marine Science, 5(405), 1-14. Doi: 10.3389/fmars.2018.00405


A Multi-Faceted and Comprehensive Approach to Understanding San Diego Bay’s Green Turtle Populations and their Origin

By: Casey Dresbach, SRC Intern

Green turtles (Chelonia mydas) have called the South San Diego Bay home since the 1850s  (National Oceanic and Atmospheric Administration (NOAA) Fisheries , 2014). Their origin however remains a mystery. There are beliefs that commercial fishermen of the mid 17th century harvested the species in Mexican waters and brought them back to San Diego Bay (National Oceanic and Atmospheric Administration (NOAA) Fisheries , 2014). Yet upon transit, many believe the turtles may have escaped and perhaps justify the presence of Chelonia mydas population in San Diego Bay today. San Diego Bay, California has been documented as one of the northern-most foraging areas for green turtles in the eastern Pacific (Figure 2). (Dutton, LeRoux, LaCasella, Seminoff, Eguchi, & Dutton, 2018)

Figure 1. Green Sea Turtle. (Caption: Green Sea Turtle, Chelonia mydas.) (Wikimedia Commons, 2010)

Figure 2. Green Sea Turtle Nesting Sites and Foraging Site. (Caption: Nesting sites (circles) of Green Sea Turtle, Chelonia mydas as well as foraging site in the northern part of San Diego Bay.) (Dutton, LeRoux, LaCasella, Seminoff, Eguchi, & Dutton, 2018)

Turtles are marine reptiles whose life history includes a terrestrial component for reproduction, where females lay their eggs on tropical or sub-tropical beaches (Miller 1997). Green turtles in the eastern Pacific Ocean continue to face threats posed by human imprint. Some of these include habitat destruction, incidental capture in commercial fisheries, and often illegal harvesting (National Oceanic and Atmospheric Administration (NOAA) Fisheries , 2014). Green turtles are listed on the IUCN as an endangered species (Dutton, LeRoux, LaCasella, Seminoff, Eguchi, & Dutton, 2018). Hence, many recent studies aim to understand their geographical patterns, how and why they end up in certain regions, to ultimately engage in comprehensive measures of conservation. The greatest threat posed to this species among several other marine and terrestrial animals is in fact the contribution of industrialization. In a 2010 study by (Eguchi, Tomoharu & Seminoff, Jeffrey & A. LeRoux, Robin & H. Dutton, Peter & L. Dutton, Donna), the abundance and survival rates of green turtles in an urban environment was examined. The coexistence of humans and an endangered species was analyzed specifically because of the turtles’ proximity to warm effluent from a power plant nearby. With 99 capture sessions between 1990-2009, 96 turtles were caught. Researchers constructed design-mark-recapture models to estimate abundance and recapture rates. This work provided both the first survival rate and abundance estimates for a green turtle foraging population in industrialized San Diego Bay (Eguchi, Tomoharu et. al 2010).

In 2018, a study was conducted to reveal the origin of the green turtle population in San Diego Bay. In aiming to understand population structure and migration patterns, researchers used a combination of genetics and satellite telemetry to identify the nesting stock origin of Chelonia mydas foraging in San Diego Bay (Dutton, LeRoux, LaCasella, Seminoff, Eguchi, & Dutton, 2018). They examined the stock origin of green turtle foraging aggregation in San Diego using segregated pieces of mtDNA (770 bp) from 121 green turtles captured in San Diego and then compared them to nesting populations across the greater Pacific. Mixed stock analysis was conducted to look at where all these green turtles had originated. This provided indication that the San Diego Bay foraging population originates from eastern Pacific nesting sites, primarily the Revillagigedo Archipelago and the coast of Michoacán, Mexico (Dutton, LeRoux, LaCasella, Seminoff, Eguchi, & Dutton, 2018). Further evaluation of current life history hypotheses was enhanced with the satellite tagging of 3 female green turtles in the San Diego foraging ground (FG) to track migration patterns. After 364 days, one had nested at Socorro Island in Revillagigedo and returned to San Diego Bay and another was tracked nesting at Tres Marias Islands near the Mexican mainland coast. Of critical importance was that all three returned back to San Diego Bay. These findings locate green turtle populations from Revillagigedo Islands and Michoacán as well as the Tres Marias Islands. Their findings supported the mixed stock analysis indication of where the San Diego foraging population originates. With more insight and accumulation of data such as these, heightened conservation efforts in areas such as the Tres Marias Islands, Revillagigedo Islands, and Michoacán can be done.

Further research needs to be conducted to better understand the migration patterns and selection of FG in lieu of the threats posed by the human imprint. Despite scientific efforts, the general public can have a major influence on further conservation of the species. Public outreach and engagement is a multifaceted tool that informs those both inside and outside of scientific communities and often simultaneously establishes a personal connection to an area of concern. Pairing an unfamiliar subject matter with something recognizable will not only incite curiosity but also serve better when trying to relay conservation messages to a wider audience. For example, when a child is introduced to a topic of subject matter in a way that is familiar to them through art or a game, he or she is more likely to engage (See Figure 3). With that personalization comes a greater likelihood that an individual or set of individuals will pursue that newfound connection further. Especially when the matter, such as polluting by the coast, will affect their and those of generations to come. With urbanization on the rise and industrialization seeping further into coastal habitats marine and terrestrial life are suffering at that expense. Disseminating knowledge about how the human imprint is and will continue to deteriorate ecosystems worldwide is crucial to inciting behavioral changes.

Figure 3. Sea Turtle outreach at the San Diego International Airport JPEG aligned in text to the left. (Caption: Public outreach and engagement is crucial to bridging the gap between the informed and the uninformed. The engagement of students is critically important as they become the next generation and future voices of change).

Work Cited:

Dutton, P. H., LeRoux, R. A., LaCasella, E. L., Seminoff, J. A., Eguchi, T., & Dutton, D. L. (2018, November 8). Genetic analysis and satellite tracking reveal origin of the green turtles in San Diego Bay . Marine Biology .

Eguchi, Tomoharu & Seminoff, Jeffrey & A. LeRoux, Robin & H. Dutton, Peter & L. Dutton, Donna. (2010). Abundance and survival rates of green turtles in an urban environment: Coexistence of humans and an endangered species. Marine Biology. 157. 1869-1877. 10.1007/s00227-010-1458-9.

Miller JD (1997) Reproduction in sea turtles. In: Musick JA, Lutz PL (eds) Biology of sea turtles. CRC Press, Boca Raton, pp. 51–82

National Oceanic and Atmospheric Administration (NOAA) Fisheries . (2014, December 24). Green Sea Turtle Research at San Diego Bay. Retrieved from NOAA Fisheries : https://swfsc.noaa.gov/textblock.aspx?Division=PRD&ParentMenuId=212&id=10134

NOAA. (n.d.). San Diego Bay Sea Turtles. (P. Dutton, Producer) Retrieved from National Oceanic and Atmospheric Administration (NOAA) Fisheries: https://swfsc.noaa.gov/textblock.aspx?Division=PRD&ParentMenuId=212&id=4378

Senko J, López-Castro MC, Koch V, Nichols WC (2010) Immature East Pacific green turtles (Chelonia mydas) use multiple foraging areas off the Pacific coast of Baja California Sur, Mexico: first evidence from mark-recapture data. Pac Sci 64 (1):125–130. https://doi.org/10.2984/64.1.125

Wikimedia Commons. (2010, May 10). Green turtle swimming over coral reefs in Kona. Retrieved from Wikimedia Commons: https://commons.wikimedia.org/wiki/File:Green_turtle_swimming_over_coral_reefs_in_Kona.jpg

Harmful Algal Blooms and Climate Change: Exploring Future Distribution Changes

By: Chris Schenker, SRC Intern

Across the globe, the effects of climate change are manifesting. Due to anthropogenically-induced environmental changes, the geographic occurrence of many species is being altered, and algae is no exception. Under the right environmental conditions, some algal species can cause harmful algal blooms (HABs) which create toxins and produce many harmful side effects. Fisheries are affected by HABs, as are some filter feeding species. Many commercially important bivalves, such as shellfish, retain these harmful chemicals in their tissue for up to six months. This means that one prolonged algal bloom can close coastal aquaculture and fisheries for months at a time, creating negative economic impacts and posing a threat to public health. Vulnerable species and ecosystems are also sensitive to HABs, and one bad event can push a species to extinction or make long lasting ecosystem-wide changes.

Figure 1: Many commercially important species of shellfish are under threat due to harmful algal blooms. (Source: Unsplash.com)

Worldwide, blooms have increased in frequency and impact. Different algal species are affected in different ways by environmental conditions, but it is possible that manmade changes have played a part in this. Many HABs that used to only occur at lower latitudes have crept north in recent years, and in this paper, Townhill et al. (2018) aimed to use species distribution modeling to provide a broad overview for “changing geographic affinity” (p. 1884). Using a high-resolution climate model integrated into global climate model outputs, the authors were able to incorporate a species’ global environmental exposure into its habitat suitability function. The “habitat suitability function” was constructed from data on species occurrence for a number of algal species, with an emphasis placed on variables most believed to affect algal occurrence, such as near bottom and sea surface temperature and salinity, differences between the surface and bottom values for each, and bathymetry. Next, a “relative habitat suitability” score between 0 and 1 was generated by running the data through the Maximum Entropy (Maxent) model which describes hydrographic and bathymetry conditions that a species currently seems to favor. Finally, the model was used to generate predictions of the latitudinal center of a species’ distribution in the near-term (2040-2069) and long-term (2069-2098). The estimates were used to understand how a species general distribution may change from the present.

Figure 2: All species studied are expected to experience a global shift towards the poles. (Townhill et al., 2018)

Every species studied was projected to experience a northward global shift, with most of the change occurring at end of the century. Bathymetry and near bed temperature were found to be the variables with the greatest contribution to model fit. All but three species experienced a northward shift in the Northern European shelf seas, with D. acuta and Gymnodinium catenatum having the greatest at 800-1000 km northwards for mid and end of century. G. catenatum was also predicted to have the largest northwards shift globally with an estimate of more than 700 km.


Figure 3: Alexandrium minutum is predicted to have a southward shift in shelf seas, while the other three species shown are expected to have the greatest northward shift. (Townhill et al., 2018)

Although there are differences in species-specific predictions compared to other studies, the work of Townhill et al. (2018) highlights the need for near- and long-term forecasting to understand the risk of future algal species redistribution. More sophisticated future models will likely lead to better predictions, allowing researchers to stay abreast of ecological trends. However, it is also important to understand that relative suitability helps us understand which species might become more prevalent and therefore need closer monitoring, but it is impossible to predict blooms based on abundance data alone. For that, local and near-term environmental conditions are much more important. Thus, this brand of species distribution modeling is meant to supplement conventional monitoring efforts, not replace them.

Work Cited:

Townhill, B. L., Tinker, J., Jones, M., Pitois, S., Creach, V., Simpson, S. D., Dye, S., Bear, E., and Pinnegar, J. K. Harmful algal blooms and climate change: exploring future distribution changes. ICES Journal of Marine Science, 75: 18821893.

Deepwater Horizon Crude Oil and its Implications on the Atlantic Stingray, Hypanus sabinus

By: Casey Dresbach, SRC Intern

Since WWII, the extraction of oil has rapidly revolutionized the way we live. The twentieth century is actually deemed the “century of oil.” The world’s dependency on oil is primarily on Petroleum, also known as crude oil. Crude oil is a complex and naturally occurring mixture of petroleum, which is formed by breaking down large molecules of oils, waxes, and fats  (Penn State College of Earth and Mineral Sciences). This is not a modern process and has actually been around for hundreds and millions of years. When marine organisms die, they sink to the bottom of the ocean and are buried in clay, silt and sand. When physical factors come into play – pressure and heat – they facilitate transformation to crude oil. It is stored in impervious rock beneath the earth’s surface. The fuel, which we use today to serve our industrial needs, can be extracted by drilling through this rock. However, crude oil contains a variety of lethal chemical constituents some of which include benzene, hydrocarbons, toluene, and heavy metals (Cave & Kajiura, 2018). Unnaturally high levels of exposure to these chemicals have shown to damage sensory systems in teleost fish, bony fish. Such exposure is due to oil spills, when extraction activities fail to excavate without seepage. The flammable nature of crude oil is subject to possible explosion and fire with faulty production processes.  These unnatural spills result in high levels of liquid petroleum releases into the environment.

Figure 1. World distribution of petroleum and oil resources.). (Penn State College of Earth and Mineral Sciences)

Most of the world’s petroleum is found in the Middle East (See Figure 1). Yet many countries, including the US, wish to extract oil domestically. Several nations seek out ways in which they can attain the fuel, some of which include large-scale rigs in the middle of the ocean. Deepwater Horizon operated as a floating drilling rig, which functioned to extract oil from deep below the water’s surface. However, on April 20th, 2010 one of the largest spills in the history of marine oil drill operations occurred: The Deepwater Horizon (DWH) oil spill in the Gulf of Mexico on the BP-operated Macondo Prospect. 4 million barrels of oil flowed from the damaged Macondo well over an 87-day period, before it was finally capped on July 15, 2010 (EPA, 2017). 11 workers died and hundreds and thousands of organisms as well as their ecosystems continue to suffer the implications of the explosion.

Figure 2. Five years after Deepwater Horizon Oil Spill.) (WWO, 2015).

Spilled oil can harm all kinds organisms, due to the chemical makeup of its poisonous constituents mentioned earlier. In a study conducted by Eloise J. Cave and Stephen M. Kajiura, the impact of crude oil exposure upon sensory function was explored in an organism whose sensory organs are crucial to its existence as a predator (Cave and Kajiura 2018). The Atlantic Stingray, Hypanus sabinus and specifically their impaired olfactory functions as a result of the DWH oil spill were studied in comparison to healthy stingrays. Like all elasmobranchs, these Atlantic Stingrays are renowned for their extraordinary sensory organs. They produce a mucus that exposes the chemosensory cells to the seawater, which allows the stingray to utilize the olfactory system effectively.  It also serves as a barrier to provide a protective surface, similar to the jelly-filled pores on a shark’s Ampullae of Lorenzini. The mucus allows for chemical constituents to seep through to the olfactory system, which elicit cues for food availability for instance. If unimpaired, the system enables awareness as predators to both other marine organisms as well as threatening environmental conditions.

Figure 3. Healthy Atlantic Stingray, Hypanus sabinus.). (Snyder, 2018)

Atlantic stingrays were collected from the Indian River Lagoon in Florida. They were placed in a lab setting – in a holding tank – and tested to determine the toxicological effects of crude oil. The experimental group were exposed to a “high–energy water accommodated fraction (HEWAF) oil solution.” The control experiments were tested under identical conditions in the tank but without the added oil solution. After 48 hours of incubation time, both groups of the population set were probed with a series of amino acids to test the functionality of the sensory organs. This exposure evaluated the transport of what is called “odorants” between seawater environment and the olfactory system. Using three methods of comparison 1) response magnitude, 2) duration, and 3) onset researchers analyzed among stingrays exposed to oil solution with stingrays that were not. Researchers found that when the experimental group was exposed to amino acids, the olfactory organ responses were significantly delayed. Results showed a slower response to the stimuli of amino acids to the stingrays, which simulated those living under unfavorable conditions post DWH spill. They also noticed an increase in mucus production, which could have led to an increase in the amount of chemicals diffused through and thus, heightened impairment.

Even though the DWH oil spill dates back to nearly 8 years ago, marine ecosystems are still enduring the implications of the accident. The study discussed above was the first to employ an “electrophysiological assay to demonstrate crude oil impairment of the olfactory system in a marine fish.” Essentially, showing that elasmobranchs among other marine organisms impacted by an oil spill continually experience decreased olfactory functioning. This not only leads to further predation but also to detriments on the overall fitness of the animal leading to premature death. More research needs to be done with respect to oil spills and their implications because there is potential for certain species to die off leading to a domino effect through lower trophic levels. Oil is an important source of energy to the billions of people on the planet. Yet oil operations must be better maintained and scrutinized to ensure mass spills like the BP oil spill do not occur again. More research needs to be done to regard to the consequences marine organisms are experiencing from the oil spills. 

Work Cited:

Cave, E. J., & Kajiura, S. M. (2018). Effect of Deepwater Horizon Crude Oil Water Accommodated Fraction on Olfactory Function in the Atlantic Stingray, Hypanus sabinus. Scientific Reports .

EPA. (2017). Deepwater Horizon – BP Horizon Oil Spill. Retrieved from Environmental Protection Agency (EPA): https://www.epa.gov/enforcement/deepwater-horizon-bp-gulf-mexico-oil-spill).

Penn State College of Earth and Mineral Sciences. (n.d.). Petroleum . Retrieved from https://www.ems.psu.edu/~radovic/Chapter8.pdf

Snyder, D. (2018). Atlantic Stingray. WWO. (2015, April 16). Five Years After Deepwater Horizon Spill. Retrieved from World Wild Life WWO.

Long-term effects on long-lived ecosystems: oil spills and deep-water corals

By: Molly Rickles, SRC Intern

The Deepwater Horizon Oil Spill occurred in 2010 in the Gulf of Mexico and was one of the largest oil spills ever recorded. During the 85 days before the spill was capped, over 4.9 million barrels of oil were released. The Deepwater Horizon Oil Spill was unique because most spills occur at the surface, but this particular oil spill occurred at 1500 meter below sea level. The spill occurred at the Macondo Prospect well, which is located about 41 miles off the southeast coast of Louisiana. To clean up the oil, 7 million liters of dispersant was applied at the surface. This chemical compound was used to absorb the oil and stop it’s spreading. However, dispersant is known for being extremely damaging to marine life. This mixture of oil and dispersant was especially damaging to corals. In addition, dispersant can stay in the water for up to four years, making it extremely long lived (Frometa et al. 2017). While the chemical is efficient at cleaning oil on the surface of the water, it is very detrimental to the marine environment as a whole.

In the Gulf of Mexico, there are over 258 species of corals, making it a very diverse marine environment (Girard & Fisher, 2018). Corals are slow growing and long lived, which makes them extremely susceptible to anthropogenic stresses. This was a major concern following the spill, since there was very little baseline information on the deep-water ecosystems in the Gulf of Mexico. These deep-water reef tracts are located at depths around 1500 meters and host a variety of species, including octocorals, sponges and hermatypic corals (Silva, Etnoyer, Macdonald, 2016). The largest reef tract that was located near the oil spill is the Pinnacle Track Reef. This reef has remnants of shallow water reef that formed before sea level rise, and now hosts a variety of deep-water organisms (Frometa et al. 2017).

Figure 1: This image shows the changes in an impacted coral colony between 2011 and 2017. Healthy coral is shown in green, unhealthy coral is shown in red, colonized by hydroids is shown in yellow and purple shows unclassified coral. Girard, F., & Fisher, C. R. (2018). Long-term impact of the Deepwater Horizon oil spill on deep-sea corals detected after seven years of monitoring. Biological Conservation,225, 117-127. doi:10.1016/j.biocon.2018.06.028

Several studies began looking at deep-water reef tracks after the oil spill. There were a few studies that already had images of the reef track prior to the spill, so this was used as baseline data. After the spill, researchers took images of the reef at varying intervals for up to seven years following the spill. After the initial dispersal of oil, the reef was covered in a mixture of oil and dispersant. Most of the oil that was released from the well remained at depth, which created a plume that existed for months. In addition, oil-contaminated marine snow fell onto the reefs from the surface, which caused additional damage (Girard & Fisher, 2018). It was found that the most common type of injury was the accumulation of biofilm on the corals (Silva, Etnover, Macdonald, 2016). Other injuries included bare skeletons, broken or missing branches, overgrowth of hydroids and necrosis. In addition, taller corals displayed higher rates of injuries. The initial level of impact from the oil spill caused less healthy branches, and breakage occurred very frequently at impacted sites (Girard & Fisher, 2018). Another interesting finding was that the initial level of total visible impact was correlated to recovery time, meaning that reefs that were highly impacted by the initial oil spill were less likely to fully recover (Girard & Fisher, 2018).

While almost all deep-water reefs showed damaged from the spill, there were a few located far enough away in the Gulf of Mexico that were used as reference sites. It was determined that these reference sites were significantly less damaged than affected sites, meaning that the oil spill caused injury and damage to the deep-water reefs. These effects were magnified by the occurrence of Tropical Storm Bonnie, which occurred two months following the spill. It has been hypothesized that the tropical storm accelerated the mixing of water and oil, leading to more oil being dispersed along deep-water reef tracks (Silva et al. 2016).

Figure 2: This graph shows injury level varying by years for two reef tracks. Before the spill, the injury level was commonly zero for most of the observed sites. After 2011, the injury level is significantly higher, and the number of reefs with no injuries declines drastically. Silva, M., Etnoyer, P. J., & Macdonald, I. R. (2016). Coral injuries observed at Mesophotic Reefs after the Deepwater Horizon oil discharge. Deep Sea Research Part II: Topical Studies in Oceanography,129, 96-107. doi:10.1016/j.dsr2.2015.05.013

The Deepwater Horizon Oil Spill was an extremely damaging event to the Gulf of Mexico, and its effects are still ongoing. While many scientists focused on the visible effects of the spill such as the impact on birds, marine mammals and beaches, the majority of the effects occurred in deep-water. Since the deep-water reef tracts are the source of much of the Gulf of Mexico’s diversity, it is extremely important to study the effects of the spill on these areas. Since there was very little baseline data on these reefs before the spill, it is necessary to establish a baseline data set of these reef tracts so damage can be more easily assessed in the future.

Work Cited:

Frometa, J., Delorenzo, M. E., Pisarski, E. C., & Etnoyer, P. J. (2017). Toxicity of oil and dispersant on the deep water gorgonian octocoral Swiftia exserta, with implications for the effects of the Deepwater Horizon oil spill. Marine Pollution Bulletin,122(1-2), 91-99. doi:10.1016/j.marpolbul.2017.06.009

Girard, F., & Fisher, C. R. (2018). Long-term impact of the Deepwater Horizon oil spill on deep-sea corals detected after seven years of monitoring. Biological Conservation,225, 117-127. doi:10.1016/j.biocon.2018.06.028

Silva, M., Etnoyer, P. J., & Macdonald, I. R. (2016). Coral injuries observed at Mesophotic Reefs after the Deepwater Horizon oil discharge. Deep Sea Research Part II: Topical Studies in Oceanography,129, 96-107. doi:10.1016/j.dsr2.2015.05.013

Bomb Radiocarbon Dating of Hawksbill Sea Turtle Carapaces

By: Delaney Reynolds, SRC Intern

After the 1941 attack on Pearl Harbor, Hawai’I, the United States declared martial law. In the decades that followed, the island of Kaho‘olawe, Hawai’I, an island considered sacred to Hawai’ian Natives, was used as a training ground and bombing range for the United States’ Army. Decades of bombing have not only created a threat for human health, but also any wildlife that lived in proximity to the sites. By the official end of the bombing in 2004, the army had detonated over 28,600 from the island and along the shoreline (MacDonald). One marine species that is of particular interest is the critically endangered hawksbill sea turtle (Eretmochelys imbricate).

Figure 1: This figure displays a carapace, as well as the correlation between carapace growth and number of growth marks on a scute. Van Houtan, Kyle S, et al. Time in Tortoiseshell: a Bomb Radiocarbon-Validated Chronology in Sea Turtle Scutes. Royal Society Publishing, 27 Nov. 2016.

Sea turtles’ shells are a plate-like structure comprised of “scutes” made of keratin, a component makes up human hair (Van Houtan 2016). Their shells are extremely tough and provide protection from predators. Bomb radiocarbon dating can also be used on shells to estimate growth and maturity and it is data like this that can aid in assessing population status. Hawksbill sea turtles happen to have an extremely reliable chronology when their carapace is carbon dated and can thus tell us their population status before, during, and after the bombing events on Kaho‘olawe to determine how their maturity might have changed or been effected by any radiation.

It has been found that the growth rate of sea turtles varies based on their age. As juveniles, their carapace may grow 4-5 centimeters per year. By age 10, their carapace growth declines to a rate of about 2 centimeters per year. By age 30, the carapace growth then declines to a rate of approximately 1 centimeter per year (Zug).

Figure 2: This figure displays the correlation of the percentage of Carbon-14 in the Porites (coral) cores and hawksbills’ shells to the year of core or shell formation. Van Houtan, Kyle S, et al. Time in Tortoiseshell: a Bomb Radiocarbon-Validated Chronology in Sea Turtle Scutes. Royal Society Publishing, 27 Nov. 2016.

Scientists from the national Oceanic and Atmospheric Administration (NOAA) sampled 36 hawksbills of “all life stages, several Pacific populations and spanning eight decades (Van Houtan 2016).” Growth lines were counted and referenced to Carbon-14 values from ascribed coral (Porites) cores. Annually, hawksbills create eight growth lines and it is the distance between each that can be used to estimate age.

In the 1960s, the bombing in Kaho‘olawe began to pick up and this increase can be seen in hawksbill shells’ percentage of Carbon-14 in Figure 2. At the end of the 1970s, the bombing’s demise began as Native Hawai’ian protesters risked their lives to garner the attention of their government. The bombing came to a complete halt in 1993 when Congress voted to end all military use of Kaho‘olawe and transferred the island from martial law back to the state (MacDonald 1972). This decrease in bombing can also be seen in the hawksbill shells’ percentage of Carbon-14 in Figure 2. This tells us that using the bomb radiocarbon dating of hawksbills’ carapaces is an accurate tool for aging. It was determined that wild hawksbills reach maturity between 17 and 22 years of age and captive hawksbills will reach maturity in approximately 12.3 years (Van Houtan 2016).

These bomb radiocarbon dating values also propose a decline in hawksbill trophic status. The same increase and decrease in Figure 2 appear in the coral cores. This may suggest that coral losses may lead to the degradation of sea turtle populations. It has been observed that hawksbill population size is linked to reef structure, but further study is necessary to know for sure.

Figure 3: Hawksbill Sea Turtle “Hawksbill Sea Turtle.” Wikipedia, Wikimedia Foundation, 6 Oct. 2018, en.wikipedia.org/wiki/Hawksbill_sea_turtle.

Hawksbill sea turtles were distinctively oppressed in the historic global tortoiseshell trade because their carapaces contained an abundant amount of structurally aesthetic keratin. Their shell has historically been used to craft jewelry and illegally sold (National Park Service 2017). They were listed as critically endangered by the IUCN in 1996 and placed under the protection of the Federal Endangered Species Act in 1973. In 1991, the State of Florida also passed the Marine Turtle Protection Act prohibiting the “take, possession, disturbance, mutilation, destruction, selling, transference, molestation, and harassment of marine turtles, nests or eggs (Marine Turtle Protection, Florida Fish and Wildlife Conservation Commission).” According to a 2013 report from the National Marine Fisheries Service and U.S. Fish and Wildlife Service, hawksbill populations in the United States seen both declines and recoveries in the last 20 years, but in many cases population trends were unknown.

In Hawai’i, to aid in recovery, the National Park Service has created the Hawai’i Island Hawksbill Turtle Recovery Project to monitor and protect the hawksbills and their nesting habitats found on all Hawai’ian Islands. Acting as predators to mollusks and prey to shark species, sea turtles help to keep the food web in balance and populations in check. As they are a critically endangered species and become increasingly more vulnerable to plastic pollution, consuming plastic grocery bags that resemble jellyfish for example, it is absolutely crucial for us to protect precious sea turtles and their nesting habitats.

Works Cited:

“Hawksbill Sea Turtle.” Wikipedia, Wikimedia Foundation, 6 Oct. 2018, en.wikipedia.org/wiki/Hawksbill_sea_turtle.

“Honu’ea (Hawaiian Haksbill Turtles).” National Park Service, U.S. Department of the Interior, 6 July 2017, www.nps.gov/havo/learn/nature/turtles.htm.

MacDonald, Peter. “Fixed in Time: A Brief History of Kahoolawe.” CORE, 1972.

“Marine Turtle Protection.” Laws/Regulations/Handbook, Florida Fish and Wildlife Conservation Commission, myfwc.com/wildlifehabitats/managed/sea-turtles/protection/.

National Marine Fisheries Service & U.S. Fish and Wildlife Service (2013). 5-YEAR REVIEW Hawksbill Sea Turtle/Eretmochelys imbricate, https://www.fws.gov/northflorida/seaturtles/Docs/2013_hawksbill_sea_turtle_ESA_5-year_Status_Review_FINAL.pdf

Meylan, Anne B, and Marydele Donnelly. Status Justification for Listing the Hawksbill Turtle (Eretmochelys Imbricata) as Criticallyl Endangered on the 1996 IUCN Red List of Threatened Animals. Chelonian Conservation and Biology, 1999.

Van Houtan, Kyle S, et al. Time in Tortoiseshell: a Bomb Radiocarbon-Validated Chronology in Sea Turtle Scutes. Royal Society Publishing, 27 Nov. 2016.

Zug, George R, et al. Age and Growth of Hawaiian Green Seaturtles (Chelonia Mydas): an Analysis Based on Skeletochronology. NOAA, 20 Aug. 2001.


The Future of Maryland’s Chesapeake Bay: Artificial Reefs Pose as Successful Mechanism for Oyster Population Restoration

By: Sydney Steel, SRC Intern

Nestled in the Mid-Atlantic, the Chesapeake Bay is renowned for being home to countless oysters, which contribute to the overall health of the ecosystem by providing food, protective reef habitat, and necessary water filtration. For centuries, Eastern Maryland’s economy has been dependent on harvesting seemingly-infinite numbers of bivalves, however oyster species have been experiencing significant declines due to overharvesting, shifts in water temperature and salinity, and increased pollution (Baggett et al., 2015). Without even taking into account the economic burden associated with decline of a historic industry, the diminution of oyster populations and subsequent loss of available oyster shell reefs in the Bay has culminated in a lack of a suitable protection and nursery habitat for countless marine species (Walles et al., 2016).

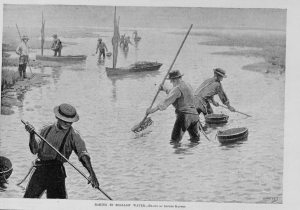
Figure 1. Oyster harvesting in the Chesapeake Bay in 1890 (Image Source: Library of Congress).

Natural oyster reefs not only benefit the wellbeing and abundance of marine species through the provision of a protective habitat, these natural reefs act as barrier islands which can calm waves, collect sediment, and reduce coastal erosion (Baggett et al., 2015). Natural reefs are also exceptionally productive and full of species diversity, and all of the bivalves attached to the reefs provide necessary filtration that improves overall health and water quality of the Chesapeake Bay (Baggett et al., 2015). Unfortunately, anthropogenic factors have impacted a once self-sustaining reef to the point of wide scale population depletion, as the native eastern oyster (Crassostrea virginica) population is the Chesapeake Bay has been reduced to just 1% of its original, pre-industrial abundance (Lipcius and Burke 2018). Although conservation of the Bay as a whole dates back for decades, substantial oyster conservation efforts did not begin in the Chesapeake Bay until 1993 (Hernández et al., 2018).

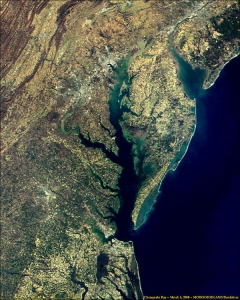
Figure 2. 2000 satellite image of the Chesapeake Bay watershed in the United States Mid-Atlantic (Source: MODIS Satellite).

When observing oyster population levels on a national scale, the native eastern oyster (Crassostrea virginica) in the Atlantic and the Olympia oyster (Ostrea lurida) in the Pacific have experienced a collective 88% decline in total biomass and a 64% reduction of natural oyster reef area over the last 200 years (Lipcius and Burke 2018). Because the durability of oyster populations is reflected by a positive feedback mechanism in which intergenerational accumulation of oysters in the Bay produces the substrate (natural shell reef) necessary for the success of the next oyster generation, the past decline of oysters directly contributes to future devastation (Walles et al., 2016). These oyster populations have been greatly affected by overharvesting, loss of preferred habitat, eutrophication, and disease – all of which can be attributed to increase human activity in coastal zones.

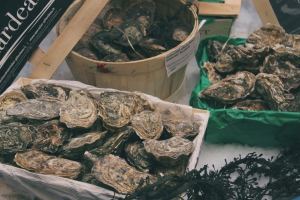
Figure 3. Harvested oysters from the Chesapeake (Image source: Unsplash).

Decades of intensive harvesting of the Chesapeake’s oyster populations have proven detrimental to the Bay’s natural reefs, thus producing a need for organized species restoration in order to bring about lasting results. Collaborative solutions have been posed to establish protected marine zones and install artificial reefs (ARs) that allow for bivalves to attach, grow, and proliferate on a concrete replacement to the preferred natural oyster shell substrate (Walles et al., 2016). The ARs designed for oyster population restoration generally consist of two main rebar-reinforced concrete models: a single-level model and a multi-level model, however both designs serve similar purposes in which oysters can attach to to the fronts and sides of these connected concrete platforms (Lipcium et al., 2018).

These concrete ARs were first introduced to the United States in the 1980s, and have since become the subject of extensive bivalve conservation research; The amount of AR research proves to be indicative of the vast positive economic and environmental implications associated with AR installation in key ecosystems (Lee et al., 2018). However, much of the research that has been conducted on ARs as a mechanism for oyster conservation is qualitative and observational, and increased quantitative studies must be conducted to determine long-term effectiveness. In 2018, a quantitative study aimed to analyze the successes of ARs by looking at population structure, density, abundance, and biomass of two of the Bay’s most prominent species – the Eastern Oyster (Crassostrea virginica) and the Hooked Mussel (Ischadium recurvum) – on three pre-installed ARs (Lipcius and Burke 2018). The study found “heavy colonization” of bivalves on all three ARs, as well as a positive relationship between the density of oysters and mussels. The average density of oysters on a classic 5-level AR structure was 1041.1 m2, and many of the oysters were young or of reproductive age (41% <1 year old, 58% 1+ year of age, 1% error) which connotes the potential for successive generations of oysters (Lipcius and Burke, 2018).

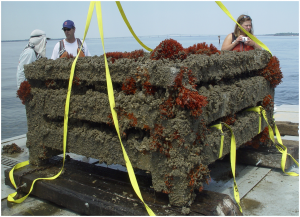
Figure 4. Simple artificial reef model, average density of oysters determined by Lipcius and Burke (2018).

The observed benefits of these artificial oyster reefs in the Chesapeake Bay have been prominent, however inadequately- defined standards of AR success and inconsistent monitoring are the proposal’s most blatant concerns. In 2015, a working group consisting of The Nature Conservancy and the NOAA Restoration Center in partnership with research institutions from Alabama and Florida proposed a handbook of universal guidelines for artificial reef management and oyster habitat restoration (Baggett et al., 2015). As oyster populations in the Chesapeake Bay continue to remain uncertain, the goals of Bay restoration include a) brood stock and population increases in areas surrounding the installed ARs, b) local habitat improvement for both resident and transient species, c) enrichment of nearby and connected habitats, and d) improved water clarity in the Bay (Baggett et al., 2015).

Because large-scale implementation of ARs harness the ability to counteract major anthropogenic-induced shifts in marine ecosystems such as species decline, global climate change, and sea acidification, the Chesapeake Bay is expected to continue investing in the ecological and economic benefits of artificial reef construction (Lee et al., 2018). Oyster population restoration has surged in the Chesapeake Bay in the past decade, and it is not expected to slow down soon – the greatest ecological benefits of these artificial reefs on Maryland’s most cherished body of water are yet to come.

Work Cited:

Baggett, L. P., Powers, S. P., Brumbaugh, R. D., Coen, L. D., DeAngelis, B. M., Greene, J. K.

Hancock, B. T., Morlock, S. M., Allen, B. L., Breitburg, D. L., Bushek, D. , Grabowski, J. H., Grizzle, R. E., Grosholz, E. D., La Peyre, M. K., Luckenbach, M. W., McGraw, K. A., Piehler, M. F., Westby, S. R. and zu Ermgassen, P. S. (2015), Guidelines for evaluating performance of oyster habitat restoration. Restor Ecol, 23: 737-745. doi:10.1111/rec.12262

Hernández, Ada Bersoza, Robert D. Brumbaugh, Peter Frederick, Raymond Grizzle, Mark W.

Luckenbach, Charles H. Peterson, and Christine Angelini. “Restoring the Eastern Oyster: How Much Progress Has Been Made in 53 Years?” Frontiers in Ecology and the Environment 16, no. 8 (2018): 463-71. doi:10.1002/fee.1935.

Lee, M. O., Otake, S., & Kim, J. K. (2018). Transition of artificial reefs (ARs) research and its prospects. Ocean & Coastal Management,154, 55-65. doi:10.1016/j.ocecoaman.2018.01.010

Lipcius RN, Burke RP (2018) Successful recruitment, survival and long-term persistence of eastern oyster and hooked mussel on a subtidal, artificial restoration reef system in Chesapeake Bay. PLoS ONE 13(10): e0204329. https://doi.org/10.1371/journal.pone.0204329

Walles, B., Troost, K., Ende, D. V., Nieuwhof, S., Smaal, A. C., & Ysebaert, T. (2016). From artificial structures to self-sustaining oyster reefs. Journal of Sea Research,108, 1-9. doi:10.1016/j.seares.2015.11.007