Mapping nearly a century and a half of global marine fishing: 1869-2015

By Peter Aronson, SRC intern

Industrial fisheries are necessary for food security and public health worldwide.  They are expected to become even more important as the human population grows and the climate changes.  The global industrial fishing fleet has expanded to cover most of the world’s oceans, however there aren’t modern global overviews of the industrial fishing fleet. In this study, Watson and Tidd (2018) mapped global fishing patterns, demonstrating the value of mapping’s impact on fisheries management.  Reliable data is available from as old as 1869 and has been compiled with recent data to better understand global fisheries patterns (Watson 2017).


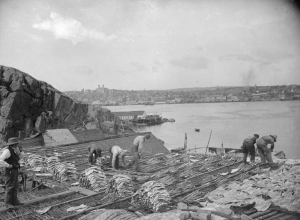
Figure 1: Fishermen drying codfish in Saint John’s, Newfoundland, Canada, circa 1900.  Cod were once very abundant off Newfoundland, but the fishery collapsed due to overfishing and a moratorium was placed on cod in Newfoundland in 1992.  Image source: McCord Museum, Wiki Commons.


Data was sourced from publicly available websites and used to compile a map of reported catches, which also contained estimates of illegal, unreported, and unregulated (IUU) fishing.  Data from the United Nations Food and Agriculture Organization (UNFAO) was compiled from 1950-2015, and the most location-specific data was used.  Data was adjusted to account for certain factors such as fishing gear, tuna fisheries, and satellite inaccuracies.  Additionally, it was separated based on whether the fishery was industrial or non-industrial to determine each sector’s impact on fisheries and how to manage each on its own.


The only nations that reported their catch before 1900 were the United States, Canada, and Japan.  More countries began reporting between 1900 and 1950, but fisheries weren’t as extensive because of a lack of technology for preserving fish once caught, causing fisheries to remain primarily coastal.  Right before WWII, fleets expanded greatly.  Reported catch declined again during the war, but after it rose right back to pre-war levels, and continued to increase greatly.  By 2000, fisheries were very expansive, and the effectiveness of management and policies varied greatly.  Despite more intense efforts, catch hasn’t increased in recent years.  Mapping fishing efforts creates data which can track which countries are catching the most fish over time.  Countries that have dominated fisheries at various times since 1869 include the United States, Canada, Japan, the United Kingdom, China, Peru, India, and the USSR.  Fish caught prior to 1900 usually lived near the seafloor, but since target species have spread to fish living in the water column.  Now, many types of species such as shrimp, squid, and tuna living in many ocean habitats are targeted.  Although extrapolation of fishing gear to reported catch prior to 1950 wasn’t feasible, some technologies that had major impacts on industrial fishing had already arisen, such as steam engines, diesel propulsion, and freezers.  Overall since 1950, practices involving seining have decreased and bottom and midwater trawling have increased.


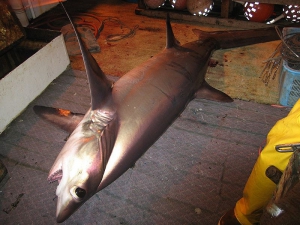
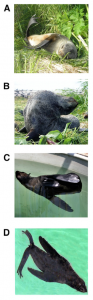
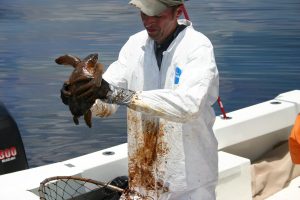
Figure 2: Many sharks are caught accidentally in fisheries when they aren’t targeted by fishermen.  In this image, a bigeye thresher shark (Alopius superciliosus) was caught as bycatch.  Bigeye thresher sharks are listed as vulnerable by the International Union for Conservation of Nature (IUCN).


Today, the fishing industry has become so advanced that it can capture fish almost anywhere on earth.  Mapping is important because fish are a finite resource if used unsustainably, and fisheries could collapse.  Fish not only feed, but nourish billions of people around the world, providing important nutrients that many people, especially in impoverished regions, can’t obtain elsewhere.  Mapping allows for an accurate, easily communicable overview of the most heavily fished regions of the ocean, and where management is most needed.  In the future, mapping fisheries may be even more important.  Climate change threatens to change the distribution and productivity of stocks worldwide.  As technologies improve, mapping will become more accurate.  Fisheries have changed greatly since the 1860’s.  Viewing patterns in fisheries since then can help inform and make better decisions about maintaining marine resources into the future.

Works Cited

Watson, R. A. 2017. A global database of marine commercial, small-scale, illegal and unreported fisheries catch 1950-2014.  Scientific data 4: Article number 170039.

Watson, R. A., and Tidd, A. 2018.  Mapping nearly a century and a half of global marine fishing: 1869-2015.  Marine policy 93: 171-177.

“Climate-driven range shifts of the king penguin in a fragmented ecosystem”: a summary of the effects of anthropogenic climate change on habitat fragmentation through genomic analysis in the king penguin community

By Julia Saltzman, SRC intern

Climate change is a hot topic today, not only in the world of science, but also in the world of politics and policy (Figure 1). Despite this fact, it has not been until recently that scientists have started to study the impacts of climate change on specific species. Because anthropogenic climate change is known to have important consequence across biologic communities, having and understanding of the nature and extent of species’ responses is crucial in modeling policy for effective environmental change (Cristofori Et. Al., 245). In the article, Climate-driven range shifts of the king penguin in a fragmented ecosystem, research is discussed which focuses on the upper-level predator, the king penguin, in one of the most rapidly changing ecosystems on the planet: the sub-Ant-arctic region.


Figure 1: global surface temperature in 2017 compared to the 1981-2010 average. High latitudes of the Northern Hemisphere were especially warm, though temperatures across most of the planet were warmer than average (red colors). (Source: NOAA Climate.gov map, based on data from NOAA NCEI.)


The king penguin exhibits high levels of dispersal, and fragmented distribution. It has been suggested that the remarkably high migration rate among colonies can explain this. In order to test this hypothesis, researchers produced a genome-wide data set (Cristofori Et. Al., 246). including about 35,000 independent polymorphic loci genotyped in 163 individuals from 13 different locations covering most of the king penguin (Figure 2). Following the data collection, it was verified that the long-term relationship between paleohabitat reconstruction and the species’ past demography can be inferred from genomic data. Based upon this paleogenetic reconstruction, which allowed or analysis of location specific genomes, found that heterogeneous environmental changes lead to uncoupled effects on different crucial areas of the king penguins’ habitat.


Figure 2: the king penguin, Aptenodytes patagonicus, at first glance appears to be very similar to the emperor penguin, however, it is smaller and completely different genetically. (Source: Wikipedia commons).


Although this data gives highly complex insight into the genomic of the king penguin community across boundaries of fragmentation, it can tell scientists and policy makers really good information about the near-future scenarios which can project changes in these penguins’ range and population size. Although some scientists may suggest that the species can evolve overtime to adapt to anthropogenic climate change (figure 3), species fragmentation, and changes in resource partitioning, past data has found that due to the king penguins’ low genetic diversity and long generation time, the species is not expected to undergo any rapid adaptive evolution to new conditions in its range. Because species fragmentation and climate change go hand in hand, not only in the king penguins’ population, but in the overall ecosystem of the earth, this data collection methodology and results can give insight into the effect of habitat fragmentation on species’ niche and genetic diversity. This data can be used collaboratively to help mitigate the effect of anthropogenic fragmentation which happens so frequently in a plethora of ecological niches.


Figure 3: From a study of detailed analysis of a recently published Antarctic temperature reconstruction, which combined satellite and ground information using a regularized expectation–maximization algorithm (O’Donnell et al. 2009).


Works Cited:

O’Donnell, R., Lewis, N., Mcintyre, S., & Condon, J. (2011). Improved methods for PCA-based reconstructions: Case study using the Steig et al. (2009) antarctic temperature reconstruction. Journal of Climate. doi:10.1175/2010JCLI3656.1

Climate Change: Global Temperature | NOAA Climate.gov, 1 Aug. 2018, www.climate.gov/news-features/understanding-climate/climate-change-global-temperature

Weintraub, Karen. “Largest King Penguin Colony in the World Drops by 90%.” The New York Times, The New York Times, 31 July 2018, www.nytimes.com/2018/07/31/science/king-penguin-decline-antarctica.html.

Cristofari, R., Liu, X., Bonadonna, F., Cherel, Y., Pistorius, P., Le Maho, Y., … Trucchi, E. (2018). Climate-driven range shifts of the king penguin in a fragmented ecosystem. Nature Climate Change. doi:10.1038/s41558-018-0084-2

Using Fish DNA in Threatened Albatross Diets as a Marine Conservation and Management Tool

By Elana Rusnak, SRC Master’s Student

There is an unavoidable interaction between seabirds and the fishing industry, which impacts them through feeding supplementation, resource competition, and incidental mortalities (McInnes et al., 2017).  However, resolving these problems is often difficult and requires many resources.  Sea-faring birds are attracted to the fish scraps that are discarded from fishing vessels, which oftentimes come from species that are not naturally a part of their diet.  Gaining access to this food source may cause an imbalance in food-web structure, allowing gull populations to inflate, or causing albatrosses to prioritize nutritionally-poor food due to its ease of capture (Foster et al., 2017).  Moreover, these fisheries may be targeting an important food source for these birds and decreasing their access to it.  Understanding the interactions between seabirds and fisheries is necessary for effective ecosystem management.


Figure 1:  A trawling boat fishing for bottom-dwelling fish to which birds would not normally have access. (Source: NOAA – en:Image:Trawling_Drawing.jpg, Public Domain, https://commons.wikimedia.org/w/index.php?curid=1232501)


In the past, the two main ways to assess seabird diet were looking at their stomach contents, and stable isotope analysis.  Unfortunately, neither of these methods yield species-specific results when it comes to what kinds of fish are in these birds’ diets.  Recently, a non-invasive process called DNA metabarcoding has been useful in providing high-level specificity in seabird diets when analyzing their waste products.  It is also a broad-scale technique, which increases the number of birds and populations that scientists can sample while decreasing the amount of work and time required to do so.


Figure 2: The black-browed albatross (Source: Ed Dunens – Black-browed Albatross, CC BY 2.0, https://commons.wikimedia.org/w/index.php?curid=64498778)t


The black-browed albatross is found in the southern hemisphere, where its population has been significantly impacted by longline and trawl fisheries.  A group of researchers used DNA metabarcoding to assess 6 sites across their breeding range to determine their prey diversity over space and time, identify if any of their prey comes from areas in which there are known fisheries operations, and evaluate potential resource competition or food supplementation by fisheries.  Albatross waste was collected, and DNA was extracted from each sample, then cross-referenced with known fish DNA.  The researchers found that 91% of their diet consisted of bony fish, with a diversity of 51 species, but the overwhelming majority of birds mostly ate 4 primary species of fish.  Samples collected from the 6 breeding sites showed differences in bird diet between sites.  A few species of fish identified from the DNA barcoding only live in the northern hemisphere, indicating that these birds are sourcing this prey from fisheries that use those kinds of fish as bait.  Depending on the site, between 0-60% of the birds were consuming fishery discards.  A few breeding sites were negatively impacted by resource competition, where the fishery was targeting their food source and they therefore did not have access to their normal diets.  This study shows that DNA barcoding has provided a means for scientists to prove that improvements in discard management to reduce the number of birds that feed from these vessels would reduce incidental mortality and have major implications for some albatross populations (McInnes et al., 2017).

Works cited

Foster, S., Swann, R. L., & Furness, R. W. (2017). Can changes in fishery landings explain long-term population trends in gulls?. Bird Study64(1), 90-97.

McInnes, J. C., Jarman, S. N., Lea, M. A., Raymond, B., Deagle, B. E., Phillips, R. A., … & Gras, M. (2017). DNA metabarcoding as a marine conservation and management tool: a circumpolar examination of fishery discards in the diet of threatened albatrosses. Frontiers in Marine Science4, 277.

How do cetaceans and other marine vertebrates avoid decompression sickness? A new explanation for beating the bends.

By Nick Martinez, SRC intern

The challenge of decompression sickness (DCS) and Nitrogen Narcosis, have always proved a threat to the deep diving vertebrates of the marine world. For years, scientists have debated over how cetaceans and other marine vertebrates are able to avoid DCS. In a recent paper from Daniel Parraga and colleagues, Pulmonary ventilation – perfusion mismatch: a novel hypothesis for how diving vertebrates may avoid the bends, the authors introduce a new hypothesis attempting to explain how this feat is actually performed.

To counter the challenges of DCS and nitrogen narcosis, cetaceans have developed a variety of adaptations that allow them to avoid catastrophic effects while diving. Many of the large deep diving cetaceans share a smaller mass-specific total lung capacity than that of shallower divers (Parraga et al. 2018). What this means is that larger whales have a comparatively smaller lung to body size ratio than that of dolphins, for example. Having a smaller mass-specific total lung capacity allows these cetaceans to have a smaller portion of their thoracic volume to be taken up and are able to have a larger vascular network. This vascular network comprises of multiple layers of alveoli, allowing there to be more oxygen storage when taking air at the surface. Smaller lungs prove more advantageous because a larger lung size would allow for more N2 absorption, increasing the risk of DCS (2018). Cetaceans also have a network of cartilaginous reinforcements that maintain the patency of airways during dives (2018). This system of cartilage allows for cetaceans to have high respiratory flow when taking breaths at the surface. The most important feature of the cartilage involves the facilitation of alveolar collapse at specific depths. Facilitating alveolar collapse prevents any excess N2 absorption into the bloodstream and thus reduces the risks of DCS (Figure 1). Finally, cetaceans have a series of vascular plexus that aid in oxygen storage and the redirection of air volume to the sound producing areas of the organism. This system of vascular control is the framework for complete DCS and nitrogen narcosis prevention. However, to understand exactly how cetaceans use their adapted bodies to prevent DCS and nitrogen narcosis, it is important to understand how they regulate gas exchange at depth various depths.

In Parraga’s paper, the author introduces the importance of gas exchange in marine vertebrates by first introducing two variables: VA and Q. VA equates to the rate of alveolar ventilation (air reaching the alveoli) while Q tells how much blood is perfusing the alveoli. These two variables are important for understanding how cetaceans are able to manage the rate of gas exchange within their body. If, for example, there were no management of gas exchange while diving, any air breathing organism would immediately fall to the effects of DCS because of the amount of nitrogen gas that is being dissolved into the blood stream. Originally, scientists believed that cetaceans controlled gas exchange by performing passive compression of alveoli and airways at specific depths. However, Parraga et al. note that this passive compression at significant depths does not explain how cetaceans prevent nitrogen related catastrophes at shallower depths. For example, many dolphins and small whales who get caught in gill nets have been found dead with signs of unregulated gas exchange, proving that regulated gas exchange is crucial at any depth. In fact, Parraga notes that between different species, alveolar collapse depth is completely variable between species.

The authors propose a new hypothesis attempting to explain how cetaceans are able to avoid DCS and nitrogen intake at any depth. This new hypothesis describes how cetaceans are able perform alterations in alveolar ventilation (VA) and perfusion (Q) that allows selective gas exchange during natural (dives not at alveolar collapse depth) and deep dives (at collapse depth). The way cetaceans perform this unique adaptation is they alter the VA/Q ratio to reduce inert gas uptake while simultaneously exchanging some O2 and CO2 (Figure 2) (Farhi et al. 1967). Altering the gas exchange ratio requires these organisms to force pulmonary gas into higher and lower parts of the lung. In doing so, a manual shut off of specific air ways occurs and it prevents blood from accessing air that would otherwise contaminate it. While unique, this process is very susceptible to failure provided that the right environmental and/or behavioral stressors are introduced to the organism.

Like all research, this information allows scientists to analyze exactly how these fragile organisms fall susceptible to anthropogenic factors. For example, beaked whales near areas of Naval sonar testing have been found stranded on beaches with gas bubbles in their blood stream (Jepson PD et al. 2003), proving that even in shallow waters, the sonars were able to disrupt the whales’ ability to manage gas exchange. The research conducted by Parraga and colleagues, and by other scientists, therefore proves vital in protecting these delicate species around the world. By understanding how cetaceans operate at various depths, scientists can turn research into policy that would help protect these organisms from population decline.


Figure 1: This figure displays a cross sectioned X-ray image of a pig (a), a grey seal (b) and a common dolphin (c) in a pressurized hyperbolic chamber. It is clear to see that the gas distribution of each organism at the same depths is different. In the pig, gas distribution stays uniform throughout but in the dolphin and seal, the air is transferred to the upper parts of the lung.


Figure 2: this figure displays the variations in the gas exchange ratios for each gas. The equation  shows how much gas exchange is going on with 0. As gas exchange ratios increase, the amount of gas that is actually being exchanged, decreases.


References

Garcia Parraga, Daniel, Moore, Michael J., Fahlman, Andreas, Pulmonary ventilation perfusion-mismatch: a novel hypothesis for how diving vertebrates may avoid the bends, proceedings of the Royal Society B: Biological Sciences 285 (2018)

Farhi LE, Yokoyama T. 1967 Effects of ventilation-perfusion inequality on elimination of inert gases. Resp. Physiol. 3, 12 – 20. (doi:10.1016/0034-5687(67)90019-9)

Jepson PD et al. 2003 Gas-bubble lesions in stranded cetaceans. Nature 425, 575 – 576. (doi:10.1038/nature 02528, 2004)

Fur Seals Suppress REM Sleep for Very Long Periods without a Subsequent Rebound

By Meagan Ando, SRC intern

There are two sleep states that all mammals and birds utilize: slow-wave sleep (SWS) and rapid eye movement (REM). REM sleep is vital to the psychological and physical well-being of living organisms. Extended periods of deprivation can cause severe dysfunction and can even lead to death (Kushida, C. A. et. al., 1989). The northern fur seal (Callorhinus ursinus) can go many days or even weeks with prolonged REM sleep deprivation as they travel through ocean waters. In general, with extended periods of non-REM sleep comes an increase in rebound REM sleep time on dry land to make up for quality sleep loss (Venancio and Suchecki, 2015). This study (by Oleg I. Lyamin et al., 2018) aimed to show that as fur seals spend their time hunting in seawater, they go long time spans with greatly reduced REM sleep and minimal rebound periods when returning to “baseline conditions”, or dry land. It was hypothesized that, since REM sleep was originally thought to be homeostatically regulated, it may actually instead serve to undo the effects that bilateral non-REM sleep has on the brain, including a reversal of reduced brain temperature and metabolism effects. This information can also prove useful in explaining the absence of REM sleep in other cetaceans, such as whales and dolphins.


This study was carried out on four juvenile northern fur seals that were captured on the Commander Islands in the Western Pacific near Russia and then transported to the Utrish Marine Station of the Severtsov Institute in the Black Sea. Various electrodes and wires were surgically implanted into the seals to measure various aspects of the seal’s brain, eyes, and neck muscles, giving researchers the ability to record REM sleep. Once the study began, each seal was tested over 2 baseline days on “dry land”, followed by 10-14 “in seawater” days, immediately followed by 2 “recovery days”. Sleep position was also noted, as it was interesting to see if there was a correlation between body positioning and sleep time (Figure 1).

Figure 1: Various sleeping positions in fur seals. These body positions help researchers identify types of sleep and how long the seal is sleeping, as it can sometimes be hard to visualize. (Oleg I. Lyamin et al., 2018 and Oleg I. Lyamin et al. 2017)

Results show that, when in water, the daily average of REM sleep time in the seals was 3 minutes, which was greatly reduced from the average of 80 minutes on dry land. The number of REM sleep episodes overall also decreased in water, dropping to 13% of baseline conditions. In total, the accumulated loss of REM sleep was 765 minutes below projected baseline amounts. Once returned to dry land, it was expected that the seals would sleep for long periods of time to make up for lost sleep. However, results showed that the amounts of REM sleep were not significantly greater when compared to baseline data (Figures 2 and 3). All of these results confirm the statement that when in seawater, fur seals greatly reduce the amount of REM sleep, followed by minimal rebound to accommodate sleep loss.


Figure 2: Comparison of REM sleep times and episodes to SWS and BSWS. REM sleep is suppressed majorly when the seals enter the water for days at the time with very little rebound after returning to dry land. (Oleg I. Lyamin et al., 2018)


Figure 3: Total percentage of REM sleep lost in comparison to baseline conditions on dry land. Again, there was very little, if any, rebound shown to recover after going many days with suppressed REM sleep. (Oleg I. Lyamin et al., 2018)


Overall, this study presents the ability of northern fur seals to be able to adjust their REM sleep schedules in water in their favor. This long closure of the eyes would eliminate the ability to see incoming attacks and would put them at a disadvantage. Also, thermoregulation is flawed during REM sleep, so the seals could potentially expose themselves to hypothermia (Parmeggiani et al., 1977). Instead, the researchers concluded that the seals perform unihemispheric nonREM sleep, which ultimately allows half of the brain to rest while the other half is alert. Further studies are encouraged to determine the relationship of this pattern among several marine species and to record temperature from both cerebral halves of the brain to better understand this ability in these mammals.

Works Cited

Kushida, C.A., Bergmann, B.M., and Rechtschaffen, A. (1989). Sleep deprivation in the rat: IV. Paradoxical sleep deprivation. Sleep 12, 22–30.

Lyamin, O.I., Mukhametov, L.M., and Siegel, J.M. (2017). Sleep in the northern fur seal. Curr. Opin. Neurobiol. 44, 144–151.

Lyamin, Oleg I., et al. “Fur seals suppress REM sleep for very long periods without subsequent rebound.” Current Biology (2018).

Parmeggiani, P.L., Zamboni, G., Cianci, T., and Calasso, M. (1977). Absence of thermoregulatory vasomotor responses during fast wave sleep in cats. Electroencephalogr. Clin. Neurophysiol. 42, 372–380.

Venancio, D.P., and Suchecki, D. (2015). Prolonged REM sleep restriction induces metabolic syndrome-related changes: mediation by pro-inflam- matory cytokines. Brain Behav. Immun. 47, 109–117.

ouFish: Capturing recreational fishing trends in in the Mediterranean Sea through social media

By Kaylie Anne Costa, SRC intern

How do you study the impacts of recreational fishing if fisherman are not expected to report what they catch? Scientists studying the impacts of recreational fishing in the Mediterranean Sea are taking a fascinating approach. By compiling over 1500 YouTube videos posted from eight countries, the scientists can analyze what species are being caught and the methods used to catch them. The six fishing methods studied were shore-angling, angling, trolling, longline, fish trapping, and spear fishing.

Shore-angling is fishing from shore without using a boat. Angling is the classic “hook, line, and sinker” technique where fishing is done from a still boat and the hook is baited with lures or baitfish. On the other hand, trolling involves fishing from a moving boat and/or with moving fishing equipment. Longline is similar to trolling as the boat is moving, but longline involves a series of over one hundred hooks hanging from one long main line. Fish trapping uses a portable pot trap left on the seafloor for a specific amount of time and spear fishing is underwater fishing with a spear gun but without dive equipment.

After watching these videos that the public had posted, the scientists noted that there was a total of 7799 fish caught. Shockingly, just 26 fish species made up more than 80 percent of the 7799 fish caught. The top 3 species that were caught most in the videos were common dentex, gilt-head seabream, white seabream, and greater amberjack . This important information highlights species that may be of increased concern when altering regulations or quotas allowed in recreational fishing. It is important to note that this data is not a complete picture of all the recreational catches, but even still, this new technique allows a glimpse into an extremely understudied area that could have drastic impacts on fisheries.

Figure 1: The common dentex, the fish species that was caught the most in the YouTube videos studied [By Yoruno [CC BY-SA 3.0  (https://creativecommons.org/licenses/by-sa/3.0)], from Wikimedia Commons]

Of these six methods, the most popular was spear fishing, which was represented in over 30 percent of the videos. Coming in a close second was trolling at 28 percent of the videos. This information can also help government officials improve regulations as well as guide future studies. Additionally, it is important to consider the additional environmental impacts of the most popular techniques. For example, when spear fishing, it may be difficult to be sure the fish is within the regulation size before shooting a fish. Since this is the most popular technique, future experiments should focus on the size of the fish caught in the recreational industry. Fortunately, fish trapping and long-lining, techniques that can cause larger amounts of bycatch, were only present in a small percentage of the videos.


Figure 2: Map showing the percentage of videos utilizing different fishing techniques by country. Gear codes: angling (AH), fish trapping (FT), longlines (LL), shore-angling (SA), spearfishing(SF), and trolling (TR) [Giovos et al., 2018]

Overall this study introduces a new way to take a glimpse into the recreational fisheries in the Mediterranean Sea and can be used in the future to study recreational fisheries all over the world. Who knows what scientific question your next YouTube video could help solve!


Works cited

Giovos, I., Keramidas, I., Antoniou, C., Deidun, A., Font, T., Kleitou, P., … & Moutopoulos, D. K. (2018). Identifying recreational fisheries in the Mediterranean Sea through social media. Fisheries Management and Ecology25(4), 287-295.

Carbon dioxide addition to coral reef waters suppresses net community calcification

By Allison Banas, SRC intern

Coral reefs play a key role in human’s daily lives. Providing food, protection, and income for millions of people worldwide are just a few of the major impacts these ecosystems have (Albright et al. 2016). Ocean acidification can lower the saturation state of aragonite mineral, which composes coral skeletons. Within this century, this acidification may cause a net loss of coral. In the past, net community calcification of coral reefs has been tested using an alkalization experiment, where the aragonite saturation state is restored. These tests have shown that present day rates are depressed compared to the values expected from the past.

Using this information, Albright et al. (2018) tested the hypothesis that near-future reductions in aragonite saturation will significantly impair net community calcification (NCC) at a community scale. The researchers used CO2 gas to increase the CO2 in the seawater flowing over a coral reef to mimic the aragonite saturation levels predicted in this century, then added a dye-tracer to the water, after which a dual tracer regression technique was used to estimate the changes in NCC. This method can compare the active tracer with a passive tracer to assess the alkalinity changes in a system.

Starting with a reef composed of 15% live coral, and 26% crustose algae, once per day for 30 days a tank was deployed and filled with ambient sea water. During 20 of the days, CO2 was bubbled into to the tank to lower the pH of the water. For a control, observations were made when dye but no CO2 was added to test the affects of just the dye. The solutions created were pumped onto the reef, and allowed to flow over the reef. Water samples were taken along a transect and were analyzed for total alkalinity, Rhodamine WT and pH (see Figure 1). Alkalinity-dye measurements from all days were analyzed using a regression approach to create ratios and background alkalinities of the transects while accounting for temporal and spatial variability.


Figure 1: Change in aragonite saturation and NCC by day. Source: Albright et al. 2018

The researchers found that addition of CO2 lowered the aragonite saturation of the water flowing over the reef, and on control days, there was no difference in saturation as compared to background condition. (See figure 2) The null hypothesis that reductions in saturation projected to occur in this century do not impair NCC was rejected via this data and t-tests (experiment: t19=11.26 P < 0.0001 and control t9 = 0.43 P > 0.05). This study takes care to note that comparison of calcification relationships derived from coral studies and mixed-reef communities may be in part from a high abundance of the coralline algae. In this study, it was shown that seawater chemistry influences dissolution as opposed to gross calcification of corals, and sensitivity of NCC to saturation may increase as saturation decreases. This authors concluded that only the reduction of atmospheric CO2 levels will combat ocean acidification.

Figure 2. Mean aragonite saturation and NCC rates for experimental and control days. Source: Albright et al. 2018.

Works cited

Albright, R., Takeshita, Y., Koweek, D. A., Ninokawa, A., Wolfe, K., Rivlin, T., … Caldeira, K. (2018). Carbon dioxide addition to coral reef waters suppresses net community calcification. Nature. doi:10.1038/nature25968

Albright, R., Caldeira, L., Hosfelt, J., Kwiatkowski, L., Maclaren, J. K., Mason, B. M., … Caldeira, K. (2016). Reversal of ocean acidification enhances net coral reef calcification. Nature. doi:10.1038/nature17155

A Contaminating Diversification: Discovering New Algal Toxins in Our Oceans and its Negative Implications

By Casey Dresbach, SRC intern

Coastal waters are one of the world’s greatest assets, yet they are being hit with pollution from all directions (U.S. Commission on Ocean Policy, 2004). As we move further into the Anthropocene, water conditions worldwide are continuing to degrade. The U.S. Environmental Protection Agency’s (EPA’s) 2002 National Water Quality Inventory found that just over half of the estuarine areas assessed were polluted to the extent that their use was compromised (U.S. Commission on Ocean Policy, 2004). Urban wastewater treatment plants, storm runoff, agricultural runoff, and animal feeding operations, are just some of the many sources in which our waters are faced with anthropogenic pollutants (See Figure 1). Eutrophication is the process by which water bodies are made more eutrophic through an increase in their nutrient supply (Smith, Tilman, & Nekola, 1999). Not only does this process cause damage on an ecological level, but it can have implications on economic impacts as well (U.S. Commission on Ocean Policy, 2004). Some of which include beach closures and severe increases in health care costs. It is the leading pollution problem that both humans and animals are facing.

Toxin Microcystin in the blue-green algae in Discovery Bay, California. Human exposure to such toxin may include dizziness, rashes, fever and vomiting.) (McClurg/KQED, 2016).

In a recent study, the San Francisco Bay (SFB) was analyzed on behalf of its responsibility for Harmful Algal Blooms (HABs) in its eutrophic estuary (Peacock, Gibble, Senn, Cloern, & Kudela, 2018). As mentioned earlier, eutrophication as a result of human induced nutrient inputs from growing urban lifestyles are increasing the frequencies of HABs. This study looked into the presence of four harmful algal toxins present in SFB’s specifically within the marine mussel, Mytilus californianus. The toxins found came from both marine and freshwater sources, an alarming discovery. “The bay is acting as a big mixing bowl where toxins from both fresh and marine water are found together,” said senior author Raphael Kudela, the Lynn Professor of Ocean Health at UC Santa Cruz. “A big concern is that we don’t know what happens if someone is exposed to multiple toxins at the same time.” (Peacock, Gibble, Senn, Cloern, & Kudela, 2018).

The four toxins found were Domoic acid, Saxitoxins, Dinophysis, and Microcystin. Domoic acid is a neurotoxin that causes amnesic shellfish poisoning in humans and is produced by marine diatoms. Saxitoxins are paralytic and primarily found in shellfish. Dinophysis are also shellfish toxins that cause severe diarrhetic poisoning. Microcystins are produced by freshwater cyanobacteria and can cause liver damage in both humans and animals. (Peacock, M. B., Gibble, C. M., Senn, D. B., Cloern, J. E., Kudela, R. M., 2018). The study was also conducted during a severe drought in California, which could have brought some of these marine toxins further into the bay due to less freshwater river flow.

NASA uses airborne remote imaging spectrometer to create maps of San Francisco Bay showing water clarity (turbidity), dissolved carbon, and Chlorophyll-a. as indicators of water quality). (NASA/Jet Propulsion Laboratory, 2016).

The presence of the toxins indicated that both the mussels and humans who consume them are exposed to poisoning at both sub-lethal and acute levels. The findings showed that 99% of the mussels collected from SFB were contaminated with one of the listed toxins and 37% had all four. Although alarming, the results served as a progressive measure towards changes and monitoring programs within several federal agencies (Peacock, Gibble, Senn, Cloern, & Kudela, 2018). The other important variable, the drought environment in which this study was conducted, is also important to consider. NASA recently published a study on behalf of their monitoring of SFB’s quality of freshwater (NASA/Jet Propulsion Laboratory, 2016). They demonstrated how an airborne environmental monitoring instrument could be useful in helping monitor not only estuarine waters native to California, but coastal waters worldwide (See Figure 2).

When studies such as these are published, it is dire for the public to grasp the central purpose of such examinations especially in the cases of eutrophication, which affect both humans and animals worldwide. Unfortunately, harmful algal blooms are assuming a more normative nature and its long-term implications absorbed by both humans and animals are not entirely understood. More research needs to be done in this sector specifically, especially when dealing with lethal and sub-lethal levels of toxins within our communities worldwide. The findings also suggest the need to better monitor both marine and freshwaters, similar to what NASA did with their study in the estuary of SFB (NASA/Jet Propulsion Laboratory, 2016).

Overall, deeper analyses should be performed in collaborative measures to incorporate a sense of inclusivity from both the public and scientific sector. Published science is readily available, however it is the proper dissemination of knowledge to human populations outside of the scientific community that is lacking. Without a fertile middle ground to interpret the specificity of what is going on in a world threatened by pollution, policy work, legal intervention, and preventative measures will be challenging to attain. Reducing water pollution will alleviate a series of pressures on both an ecological and economic scale. Cleaner coastal waters and healthy habitats for aquatic life should continue to be the primary concern for policy makers in modern marine affairs.

Works Cited

McClurg/KQED, L. (2016, August 29). Poisonous Algae Blooms Threaten People, Ecosystems Across U.S.

NASA/Jet Propulsion Laboratory . (2016, February 29). NASA demonstrates airborne water quality sensor.

Peacock, M. B., Gibble, C. M., Senn, D. B., Cloern, J. E., & Kudela, R. M. (2018). Blurred lines: Multiple freshwater and marine algal toxins at the land-sea interface of San Francisco Bay, California. Harmful Algae , 73, 138-147.

Smith, V. H., Tilman, G. D., & Nekola, J. C. (1999, March 22). Eutrophication: impacts of excess nutrient inputs on freshwater, marine, and terrestrial ecosystems. Environmental Pollution.

U.S. Commission on Ocean Policy. (2004). An Ocean Blueprint for the 21st Century Chapter 14: Addressing Coastal Water Pollution. Washington: University Press of the Pacific.

The Lasting Legacy of the Deepwater Horizon Oil Spill

By Delaney Reynolds, SRC intern

This map of how far the oil reached on the surface level of the Gulf of Mexico exhibits that the coasts of Texas, Louisiana, Mississippi, Alabama, and Florida were impacted.
(Source: Huettel, M., Overholt, W. A., Kostka, J. E., Hagan, C., Kaba, J., Wells, B., & Dudley, S. (2017, December 22). Degradation of Deepwater Horizon oil buried in a Florida beach influenced by tidal pumping. Retrieved March 13, 2018, from https://www.sciencedirect.com/science/article/ pii/S0025326X1730903)

Mankind’s use of fossil fuels as an energy source can place our natural environment at grave risk, and nowhere is that more acute than in the Gulf of Mexico. The environmental threats the Gulf region faces from petroleum production and exploration are not just those that appear in the media immediately following an oil spill or similar catastrophe, but are events that leave a lasting, often unseen legacy that stands to pollute and destroy our natural environment and the creatures that live in it for generations.

The Deepwater Horizon, British Petroleum (BP), oil spill of 2010 was the largest marine oil spill in history and polluted the Gulf for 87 days by pouring an estimated 60,000 barrels per day at its peak, and over 3.19 million barrels in total, of petroleum into the Gulf’s environment (Pallardy). The oil’s effluence rapidly spread to over 1,000 miles on the coastlines of Texas, Louisiana, Mississippi, Alabama, and Florida and while the efforts to clean up beaches and the spill itself have had some success, remnants of oil remain buried in sediments and continue to dramatically disrupt life beneath the surface (Frost).

Florida State University researchers discovered that within a week of burial, two thirds of the oil that washed ashore was retained in coastal sediments and caused a decrease in biodiversity by over 50% (Huettel). Bacterial abundance increased drastically in heavily oiled sands as the bacteria thrived off the oil and, thus, caused bacteria blooms, lowering overall oxygen content. This decrease in oxygen content, in turn, caused the decrease of biodiversity as aerobic organisms either perished or migrated to areas with a higher oxygen content. However, within three months, a resurgence in microorganisms normalized biodiversity as they restocked the coastal waters with the oxygen that aerobic organisms’ survival necessitates. Not only does this exemplify the ability of aquatic ecosystems to replenish themselves after being exposed to stressors, but it also supplies us with knowledge of the types of microorganisms that could be utilized to clean up future spills, as well as any environmental impacts they may cause to other organisms.

One example of a lasting major environmental impact of the spill to other species from exposure to crude oil is pelagic fish cardiac and swim performance impairment which, in turn, has been found to lead to the inability of embryonic development. Mahi-mahi embryos obtained from the University of Miami Experimental Hatchery and yellow fin tuna embryos obtained from the Inter-American Tropical Tuna Commission’s Achotines Laboratory were collected as experimental specimen and exposed to different dilutions of crude oil collected from the Deepwater Horizon Oil Spill site, as well as varying levels of ultraviolet radiation (UV) exposure, for 96 hours in a pelagic embryo-larval exposure chamber (PELEC). Mahi-mahi specimens exposed to higher levels of UV radiation were found to have a nine-fold increase in toxicity from Deepwater Horizon crude oil increasing stress levels within the fish. Yellow fin tuna survival rates were found to be significantly higher in the PELEC system than in the agitated system, meaning their survival rate decreased by a measure of 20% when exposed to crude oil and UV radiation (Steiglitz). Events such as the Deepwater Horizon oil spill can challenge pelagic fish, especially embryos and their ability to develop correctly and survive. Thus, this research provides ways in which we can begin to predict the extreme environmental conditions species would face in future oil spills, as well as examine how remnants of oil preserved in sediments may affect spawning grounds among certain species.

Kemp’s Ridley sea turtle (Lepidochelys kempii) covered in crude oil
(Source: http://www.noaanews.noaa.gov/stories2015/ 20150504-noaa-announces-new-deepwater-horizon-oil-spill-searchable-database-web-tool.html).

Another example of the diverse and devastating impact that an oil spill can have can be found in northwest Florida, where the loggerhead turtle (Caretta caretta) has been found to have varying offspring densities in nests since the Deepwater Horizon spill in 2010. Using a before-after, control-impact statistical model, researchers from the US Fish and Wildlife Service and Florida Fish and Wildlife Conservation Commission examined the historical records of loggerhead turtle nest densities and compared them to nest densities after 2010. They found that loggerhead nest densities in 2010 were reduced by 43.7% following the Deepwater Horizon oil spill and approximately 251 nests were decimated by crude oil and cleanup efforts, having a long-term impact on population sizes (Lauritsen). The drastic decline is due in part to the oil that entered “nearshore areas and washed onto beaches along the northern Gulf of Mexico shoreline during the summer of 2010, requiring extensive, disruptive activities to remove contaminated beach sand, oil, and debris” (Lauritsen). Nesting densities increased to normal rates in 2011 and 2012 suggesting some loggerhead sea turtles avoided mortality from oil saturation. Researchers later estimated that at least 65,000 sea turtles perished in 2010, likely exacerbated by oil contamination (Pallardy).

There are few places on earth as lovely and naturally beautiful as the Gulf of Mexico. From its sandy white beaches, coastal marshes and abundant estuaries, to its serene salt waters, the Gulf region is a critical environment that humans and countless animal species rely upon for food, shelter, and recreation. Sadly, since 2010 when the Deepwater Horizon spill event took place, there have been at least 234 additional oil spills here in the United States as of December 2017 (ITOPF). And while the immediate impact of a spill is unacceptable, the lasting legacy such as sediments that retain oil particles long after a spill occurs and its impact on range of species across the food chain from microorganisms to sea turtles to mahi-mahi and yellow fin tuna should concern all of us. As populations continue to grow, so too will energy needs and this, along with the constant threat from yet another oil spill and the long-term implications its pollution has on our environment, makes managing these risks, while also embracing and evolving to sustainable energy solutions, critical to nature and humans alike.

Works Cited

Frost, E. (2018, February 28). Gulf Oil Spill. Retrieved March 15, 2018, from http://ocean.si.edu/gulf-oil-spill

Huettel, M., Overholt, W. A., Kostka, J. E., Hagan, C., Kaba, J., Wells, B., & Dudley, S. (2017, December 22). Degradation of Deepwater Horizon oil buried in a Florida beach influenced by tidal pumping. Retrieved March 13, 2018, from https://www.sciencedirect.com/science/article/pii/S0025326X17309037

ITOPF. (2017, December). Oil Tanker Spill Statistics 2017. Retrieved March 15, 2018, from http://www.itopf.com/knowledge-resources/data-statistics/statistics/

Lauritsen, A. M., Dixon, P. M., Cacela, D., Brost, B., Hardy, R., MacPherson, S. L., . . . Witherington, B. (2017, January 31). Impact of the Deepwater Horizon Oil Spill on Loggerhead Turtle Caretta caretta Nest Densities in Northwest Florida. Retrieved March 13, 2018, from http://www.int-res.com/articles/esr2017/33/n033p083.pdf

Pallardy, R. (2017, December 15). Deepwater Horizon oil spill of 2010. Retrieved March 15, 2018, from https://www.britannica.com/event/Deepwater-Horizon-oil-spill-of-2010

Stieglitz, J. D., Mager, E. M., Hoenig, R. H., Alloy, M., Esbaugh, A. J., Bodinier, C., . . . Grosell, M. (2016, July 22). A novel system for embryo-larval toxicity testing of pelagic fish: Applications for impact assessment of Deepwater Horizon crude oil. Retrieved March 13, 2018, from https://www.rsmas.miami.edu/users/grosell/PDFs/2016 Stieglitz et al.pdf&p=DevEx,5063.1

Propeller Scars in Seagrass Beds: Recovery and Management in the Chesapeake Bay

By Grant Voirol, SRC intern

Seagrass beds may seem simple on the surface, but they provide a wide variety of ecosystem services ranging the biotic and abiotic, economical and ecological. Most importantly, seagrass beds protect against coastal erosion, recycle vital nutrients, and provide habitat and food for essential species for the ecosystem and for fisheries (Barbier et al. 2011). However, due to their proximity to cities and human development, these unsung heroes are often subjected to fragmentation via propeller scarring. Seagrasses occur in relatively shallow waters, and when boats and other vessels operate in these shallow depths, their propellers can grind up the sandy substrate and rip up the seagrass. This leaves a visible “scar” through the habitat (Figure 1).

Aerial photography of Browns Bay in the Chesapeake Bay (Orth et al. 2017).

In a recent paper, Orth et al. 2017 utilized the Chesapeake Bay submerged aquatic vegetation (SAV) monitoring effort through the Virginia Institute of Marine Science to assess the degree of propeller scar damage present in the Chesapeake Bay and the impact of management decisions. This allowed these researchers to examine over 25 years of aerial photography. Most studies on propeller scars in seagrass beds can only monitor for a few months to a few years, but this multi-decade effort can examine the more long-term effects of specific anthropogenic stressors as well as recovery potential. In order to measure these qualities, researchers counted the number of new scars each year as well as the length of the scars. Additionally, preliminary results allowed for the development and implementation of management strategies that can also be observed and tested for efficacy.

The researchers found that on average during the entire study period, 112 new propeller scars were found in the Chesapeake Bay each year and that the average length of each new scar was 78.5 meters long. The time required for a propeller scar to become fully vegetated again was variable. The average was about 3 years, but the range ran from 2 to 18 years in order to recover. This shows that the Chesapeake Bay has been subjected to high levels of propeller scarring over the past few decades. The study examined the fishing industry, recreational boats, and moorings and docks as potential causes of these scarring events and concluded that the main anthropogenic sources are the fishing practices of crab scraping and haul seining. Crab scraping is when boats drag metal baskets through the seagrass beds in order to harvest molting blue crabs. Surprisingly, the physical action of the basket is not the cause of the scars, but when the net on the basket gets clogged with stray pieces of seagrass, the boat must increase its power in order to continue pulling the basket through the bed. This increase is the true cause of the uprooted seagrass. Causing more damage than crab scraping is haul seining, which is where multiple boats pull nets of up to 600 meters through the seagrass beds to harvest fish. The pulling of these nets, as well as the withdrawal of the boats carrying loads of fish, causes long scars throughout the beds.

To combat these stressors on the seagrass beds, scientists, government officials, and commercial groups held meetings to discuss the issues and possible options. The commission developed a strategy that focused on the more harmful of the two practices: haul seining. The main regulations were to limit the length of nets used, prohibit the use of two boats to drag nets, limit the distance a boat could drag a net, and requiring fishermen to report where they will fish during the following 24 hours.

Two highly damaged areas of the Chesapeake Bay were monitored in order to see the effects of these new regulations. Following implementation, Browns Bay showed a significant 90% reduction in the number of new propeller scars and an 89% reduction in total length of all scars. Poquoson Flats had a 43% reduction in the number of new scars found. While this reduction in number of scar was not statistically significant, the total length of all scars in Poquoson Flats did show a significant reduction by 57% (Figure 2).

Total scar length of both a) Browns Bay and b) Poquoson Flats. Gray shaded area represents years of development and implementation of haul seining management plan (Orth et al. 2017).

Luckily for the Chesapeake Bay, a swift and scientifically based management plan could be employed that resulted in substantial improvements for the native seagrass beds. In this case, fishing activity was the main contributor to propeller scarring and not other sources. However, this is not always true. In other areas, such as the coasts of Florida and Texas, propeller scars are more often caused by recreational boat traffic, meaning that new management tactics are needed (Zieman 1976, Dunton and Schonberg 2002). Dunton and Schonberg identify the most likely cause of recreational boat damage as accidents by boaters misjudging water depth, boaters utilizing “shortcuts” through the seagrass beds, and general ignorance of the beds’ importance. In this case the best steps to move forward would be to educate the public on the importance of these communities and the harm that they may be causing as well as additional marking of channels or construction of a single channel so as to keep boat traffic confined to a single path instead of spread throughout the beds. In this way, we can keep this important ecosystem healthy and free of harmful “scar tissue”.

Works Cited

Barbier, EB, Hacker SD, Kennedy C, Koch EW, Stier AC, and Silliman BR. 2011. The value of estuarine and coastal ecosystem services. Ecological Monographs 81: 169–193.

Dunton KH, and Schonberg SV. 2002. Assessment of propeller scarring in seagrass beds on the south Texas Coast. Journal of Coastal Research SI 37: 100–110.

Orth RJ, Lefchek JS, Wilcox DJ. 2017. Boat Propeller Scarring of Seagrass Beds in Lower Chesapeake Bay, USA: Patterns, Causes, Recovery, and Management. Estuaries and Coasts 40(6):1666-1676.

Zieman, J.C. 1976. The ecological effects of physical damage from motor boats on turtle grass beds in southern Florida. Aquatic Botany 2: 127–139.